48% of CISOs rank agentic AI as their number-one attack vector for 2026. NemoClaw’s architecture — kernel-level sandbox, YAML policy engine, privacy router — addresses the security gap. But deploying NemoClaw without monitoring is like installing a security system without checking whether the cameras are recording.
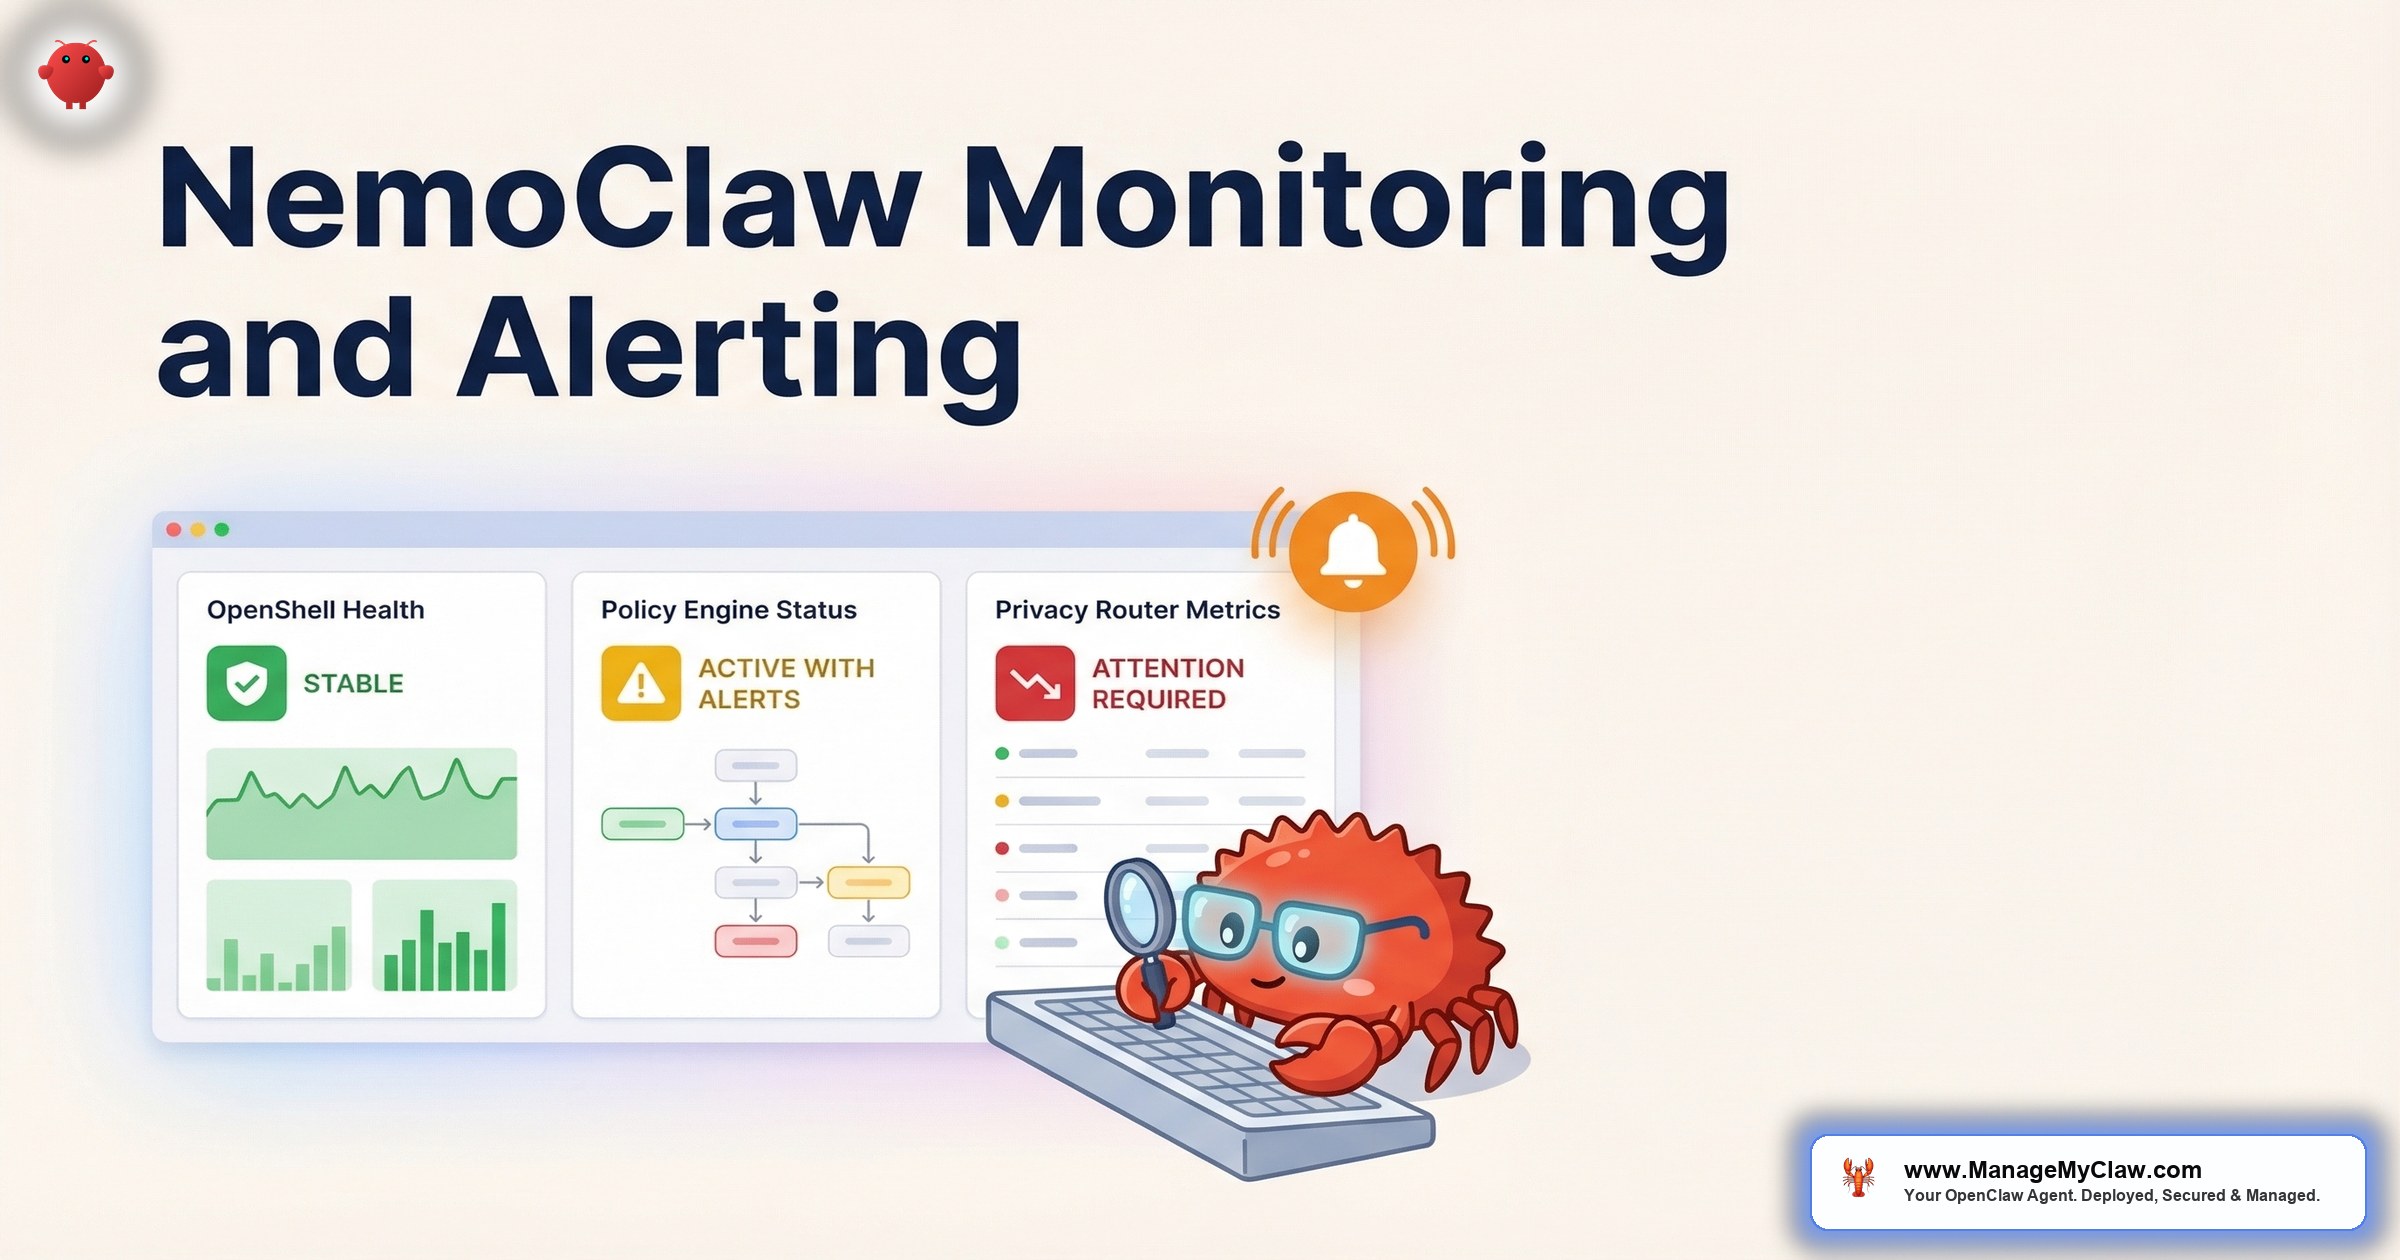
NemoClaw’s 3-component architecture (OpenShell sandbox, policy engine, privacy router) creates 3 independent monitoring surfaces. Each can fail independently. A healthy sandbox with a misconfigured privacy router still leaks sensitive data to cloud models. A working policy engine with a crashed sandbox still allows unrestricted agent actions.
Enterprise AI governance isn’t just about deploying the right tools. It’s about proving they’re working — continuously, auditably, and to the standard your compliance team requires.
This guide covers NemoClaw monitoring and alerting for production operations — what to monitor across all 3 components, how to configure alerts that map to compliance requirements, and how to build the reporting layer your CISO needs.
The 3-Component Monitoring Model
Component 1: OpenShell Sandbox
OpenShell provides kernel-level isolation using Landlock filesystem restrictions, seccomp filters, and network namespaces. Unlike Docker’s userspace isolation, OpenShell operates at the Linux kernel level — providing a security boundary that container escapes can’t bypass.
Key metrics to monitor:
- Sandbox violations per hour: Number of blocked syscalls, filesystem access attempts outside the allow-list, and network connections to unauthorized destinations. Normal baseline: 0-5 per hour for a well-configured deployment. Spikes indicate misconfiguration or an agent attempting unauthorized actions.
- Seccomp filter denials: Specific syscalls blocked by the seccomp profile. Each denial is logged with the syscall name, the process that attempted it, and the agent ID. Alert on any new syscall denial not seen in the first 72 hours of operation.
- Landlock filesystem denials: File access attempts outside the configured allow-list. Critical for detecting prompt injection attacks that try to read configuration files, SSH keys, or other secrets.
- Sandbox process health: OpenShell runs as a separate process. If it crashes, agents continue running without sandbox protection. Monitor process status and alert immediately on crash.
Component 2: YAML Policy Engine
The policy engine evaluates every agent action against 4 levels of rules: binary (allow/deny), destination (which services can be reached), method (which HTTP methods are permitted), and path (which API endpoints are accessible). OWASP ASI-01 (Excessive Agency) maps directly to this component.
Key metrics to monitor:
- Policy evaluation latency: Every agent action passes through the policy engine. If latency exceeds 100ms, agent responsiveness degrades. Alert at 200ms p99 — that indicates policy evaluation is becoming a bottleneck.
- Policy denials by rule: Which policies are blocking which actions. High denial rates on a specific rule might indicate a misconfigured policy or an agent that needs its permissions adjusted.
- Policy version and last reload: Track which version of the YAML policy file is active. When policies change, log the change, who made it, and the before/after diff. This is your audit trail for compliance.
- Unmatched action rate: Actions that don’t match any policy rule. Depending on your default-deny or default-allow posture, unmatched actions either pass through or get blocked. In a properly configured deployment, unmatched actions should be near 0.
Component 3: Privacy Router
The privacy router sends sensitive queries to local Nemotron models and general reasoning to cloud models. This is the data sovereignty layer — the component that ensures PII, financial data, and regulated information never leaves your infrastructure.
Key metrics to monitor:
- Routing decisions per classification: What percentage of queries go to local vs. cloud models. Track the trend over time. If cloud routing suddenly spikes, either your workload changed or the classification model is misclassifying sensitive data as non-sensitive.
- Classification confidence scores: The privacy router classifies each query’s sensitivity. Monitor the distribution of confidence scores. A high volume of low-confidence classifications means the router is uncertain and may be making routing errors.
- Local model availability: If the local Nemotron model goes down, what happens? In a default-deny configuration, queries queue until the local model recovers. In default-allow, sensitive queries route to the cloud — exactly the failure mode you’re trying to prevent.
- Data residency violations: Any instance where data classified as sensitive was routed to a cloud model. This should be 0. Any non-zero value is a compliance incident that requires investigation.
Alert Configuration for Compliance
| Alert | Threshold | OWASP Mapping | Response |
|---|---|---|---|
| Sandbox process down | Any crash | ASI-06 (Sandbox Escape) | Halt all agents. Restore sandbox. Investigate. |
| Privacy router: cloud routing of sensitive data | Any occurrence | ASI-09 (Data Leakage) | Halt affected agent. Audit routing table. Document for compliance. |
| Policy engine latency | >200ms p99 | ASI-01 (Excessive Agency) | Review policy complexity. Optimize rule set. |
| Sandbox violation spike | >20/hour | ASI-02 (Prompt Injection) | Review agent prompts. Check for injection attempts. |
| Local model unavailable | >5 minutes | ASI-09 (Data Leakage) | Queue sensitive queries. Do not fall back to cloud. Restore local model. |
Why this matters: Each alert maps to a specific OWASP Agentic Security Initiative control. When your compliance team asks “how do we detect excessive agency?” you point to the policy denial rate and sandbox violation count. When they ask “how do we prevent data leakage?” you point to the privacy router monitoring and the data residency violation alert. The monitoring system IS your compliance evidence.
Compliance Reporting
Monthly compliance reports should include:
- Sandbox integrity: Total uptime percentage. Number of violations. Zero breaches confirmed.
- Policy enforcement: Total actions evaluated. Denial rate by rule. Policy version changes with change log.
- Data residency: Percentage of sensitive queries routed locally. Zero cloud routing of sensitive data confirmed.
- Incident log: Any alerts that fired, response actions taken, and resolution timeline.
- Cost allocation: Per-department or per-agent API spend breakdown.
This report is the evidence package your auditor asks for. Build it into your monitoring infrastructure from day 1 — not 3 days before the audit.
The Bottom Line
NemoClaw monitoring isn’t optional for enterprise deployments — it’s the compliance evidence layer. Each of the 3 components (sandbox, policy engine, privacy router) needs independent monitoring with alerts that map to OWASP ASI controls. The monitoring data IS your SOC2 evidence. The monthly report IS your compliance proof. Without it, you have a security architecture you can’t prove is working.
Frequently Asked Questions
Can I use the same Grafana instance for NemoClaw and OpenClaw monitoring?
Yes. Grafana supports multiple data sources and dashboards. Create separate dashboards for NemoClaw’s 3 components alongside your OpenClaw agent monitoring. Use Grafana’s organization or folder features to separate enterprise monitoring from general infrastructure monitoring.
What happens if the sandbox process crashes but the agent keeps running?
This is the highest-severity failure mode. The agent continues operating without kernel-level isolation. In a properly monitored deployment, the sandbox process health alert fires within seconds, and the automated response halts all agents until the sandbox is restored. Without monitoring, the agent runs unprotected indefinitely.
How does ManageMyClaw Enterprise handle NemoClaw monitoring?
Enterprise Managed Care ($2,500-$10,000/month) includes 24/7 monitoring of all 3 NemoClaw components, monthly compliance reports, 1-hour incident acknowledgment SLA, and quarterly security reviews. The monitoring infrastructure is deployed and maintained as part of the implementation. Schedule an architecture review to discuss your requirements.
Does NemoClaw provide built-in monitoring endpoints?
NemoClaw exposes health and metrics endpoints for each component. OpenShell provides sandbox status and violation logs. The policy engine provides evaluation metrics and denial logs. The privacy router provides routing statistics and classification logs. These endpoints feed into Prometheus or your existing monitoring infrastructure.
What OWASP controls does NemoClaw monitoring cover?
Sandbox monitoring covers ASI-06 (Sandbox Escape) and ASI-02 (Prompt Injection detection). Policy engine monitoring covers ASI-01 (Excessive Agency). Privacy router monitoring covers ASI-09 (Data Leakage). Combined with CrowdStrike Falcon integration, the stack addresses 7 of the 10 OWASP Agentic Top 10 controls.
Enterprise NemoClaw Monitoring, Fully Managed
ManageMyClaw Enterprise includes 24/7 NemoClaw monitoring, monthly compliance reports, and 1-hour incident response SLA. Starting at $2,500/month for Enterprise Managed Care.
Schedule Architecture Review