“Finance professionals spend 25–40% of their time on report assembly, data reconciliation, and formatting. That’s not analysis. That’s data entry wearing a suit.”
— ManageMyClaw KPI Automation Analysis, 2026
Finance professionals spend 25–40% of their time on report assembly, data reconciliation, and formatting. That’s 10–16 hours per week per analyst spent copying data between systems, reconciling numbers, and formatting spreadsheets. Improvado’s 2026 benchmarks show AI-powered reporting tools cutting that from 12 hours per week down to 1.5 hours. And you’re not an analyst — you’re a founder. You’re doing the same work at $200–$500/hour instead of delegating it, because there’s nobody to delegate it to.
Every Monday morning, you open 4 tabs, pull numbers from 3 dashboards, paste them into a spreadsheet, and write the same summary you wrote last week — except this week’s numbers are slightly different. That’s not analysis. That’s data entry wearing a suit.
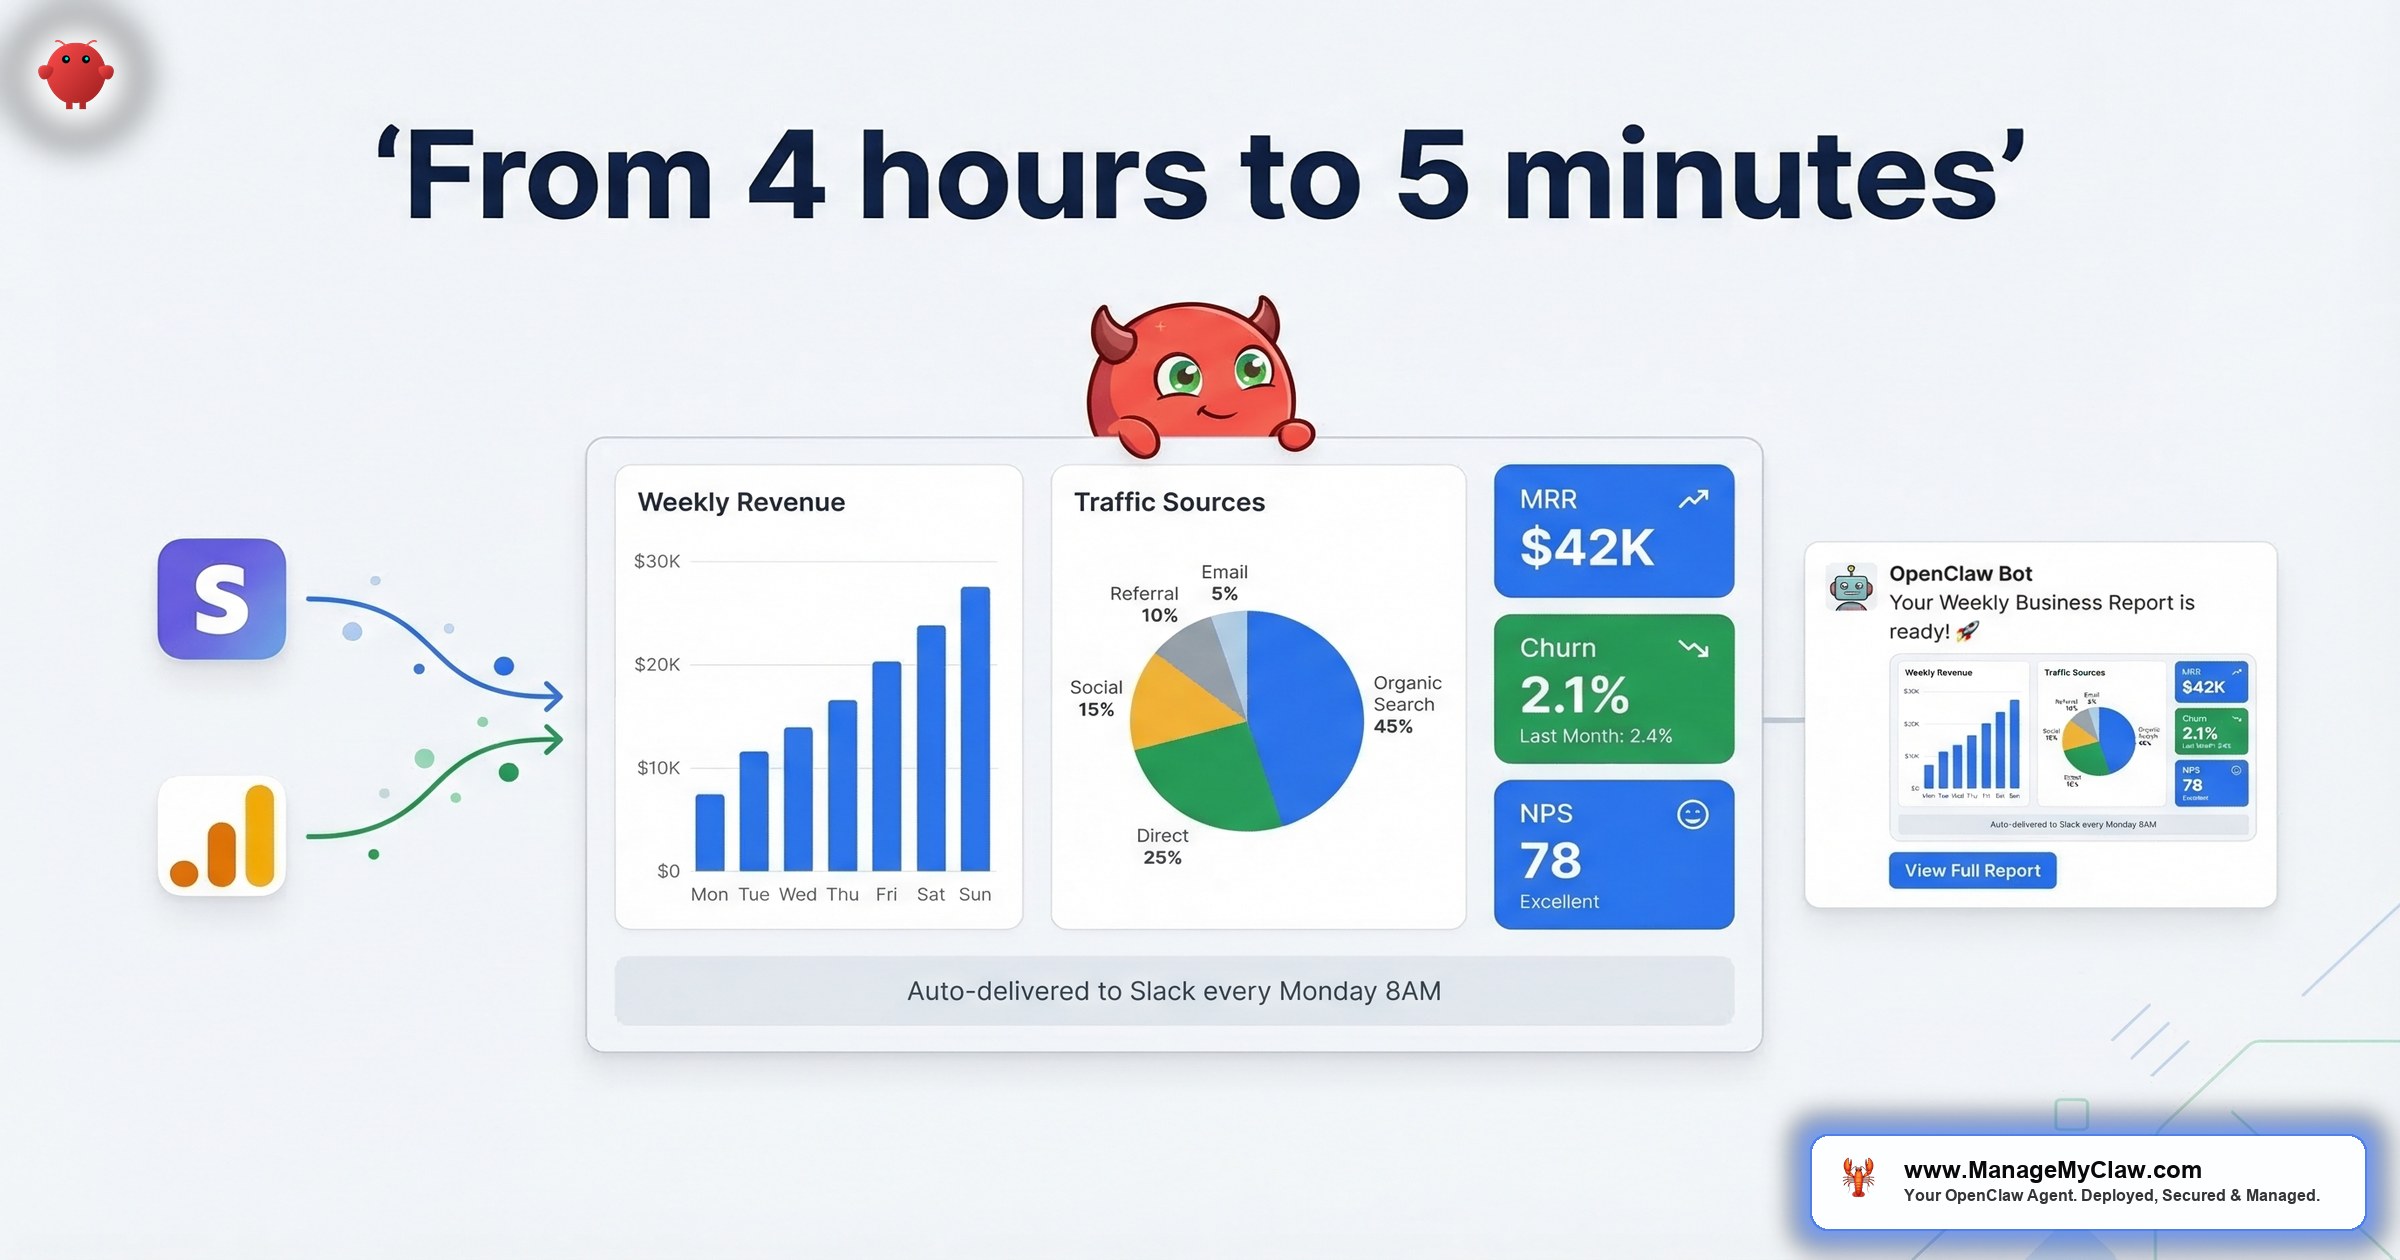
OpenClaw’s KPI reporting workflow — WF-05 — connects to Stripe, Google Analytics, and your CRM, pulls the metrics you define, formats them into a report, and delivers it to Slack or email on whatever cadence you set. 4–6 hours of manual assembly compressed to 5 minutes of agent runtime. $5–$15/month in API costs. And the report shows up whether you remember it or not — which, if you’re honest, is the real problem with manual reporting in the first place.
The Real Cost of Monday Morning Reporting
The time cost is obvious. 4–6 hours per week is half a workday — 16–24 hours per month assembling data that already exists into a format someone can read. At founder rates of $200–$500/hour, that’s $3,200–$12,000 per month on a task that produces zero new insight. You’re not analyzing. You’re collating. There’s a difference, and it costs you 2 full working days before you’ve touched your product.
But the time loss isn’t the worst part. Manual reporting has a quality problem that’s harder to see.
Your reports are stale by the time they’re done. They’re inconsistent between periods — last month used a different metric definition, this month is missing the pipeline column because you forgot, last quarter used a different date range. And the weeks you most need good data are the weeks the report gets deprioritized. Product sprint. Closing a deal. Investor meeting prep. The Monday ritual is always the first thing that slips.
You’d never hand-calculate your payroll every two weeks. But you’re hand-assembling your KPI reports every Monday like it’s 2019. The weeks you most need good data are the weeks the report gets deprioritized.
A Gartner prediction projects that by 2026, over 80% of enterprises will have deployed GenAI-enabled applications — up from less than 5% in 2023. A separate Gartner forecast puts it more precisely: 40% of enterprise applications will feature task-specific AI agents by the end of 2026, up from under 5% today. KPI reporting is one of the most natural use cases because the data already lives in APIs — Stripe, Google Analytics, your CRM. The assembly step is what’s manual. And the assembly step is exactly what agents are built to eliminate.
If you’re spending 4–6 hours per week on reports, you’re spending $38,400–$144,000 per year at founder rates on work an agent does for $60–$180/year. That’s not an optimization opportunity. That’s a rounding error you’re paying with your time.
What Founders Actually Say About Reporting
On r/automation, a thread titled “How are you all handling dashboards/KPIs/analytics for your automations?” (13 upvotes, 21 comments) surfaced the exact pattern.
“I’d start by separating internal observability from client reporting, because they’re not the same thing.”
— Top comment, r/automation KPI threadOthers described the same cycle: spreadsheets, copy-pasting from Stripe, manual formatting, reports that slip when things get busy.
On r/ExperiencedDevs, a thread titled “Anybody’s companies successfully implement something similar to Stripe’s Minions?” (81 upvotes, 46 comments) showed the engineering community asking the same question from the other side.
“That article is just a PR stunt by the author to get a high performance rating. No one I know uses minions for anything beyond trivial tasks.”
— Top comment (609 upvotes), r/ExperiencedDevs, claimed Stripe employeeThat skepticism is healthy. And it points to the real lesson: agent-powered reporting works when the scope is narrow, the data sources have APIs, and the output format is defined. KPI assembly is exactly that kind of task. It’s not creative work. It’s not ambiguous work. It’s pulling 6 numbers from 3 systems and formatting them consistently. That’s the sweet spot.
“The reason small businesses are seeing such a massive advantage isn’t just because they have access to the same brains (LLMs) as big companies, but because they can move faster on the orchestration.”
— Top comment, r/AI_Agents — “What is your full AI Agent stack in 2026?” (106 upvotes)That’s the gap. The LLM is the same for everyone. The difference is whether you’ve wired it to your actual data sources and put it on a schedule.
How WF-05 Actually Works: The Step-by-Step
Here’s what happens every Monday at 8 AM (or whatever cadence you configure):
Total agent runtime: 4–5 minutes for a standard weekly report across 3 data sources. 7–10 minutes for complex reports with historical comparisons across 6+ data points. Either way, it’s happening in the background — not in your browser tabs.
The report fires whether you remember it or not. Whether you’re traveling, in meetings all day, or closing a deal. The cadence you set is the cadence you get. Consistency alone is worth the setup — your team and investors stop wondering if this week’s numbers are coming.
Why This Is the Safest Workflow to Deploy First
If you’ve read about the inbox-wipe incident and you’re cautious about giving an AI agent access to your business accounts — good. You should be. But WF-05 is architecturally different from email triage or client onboarding, and here’s why: it’s pure read-only access on every data source.
The agent can’t write to Stripe. Can’t modify Analytics properties. Can’t update records in your CRM. It only reads. And that constraint isn’t enforced by the agent’s instructions (which can be compacted away — ask Summer Yue about that). It’s enforced at the OAuth permission scope level. When you authorize Stripe through Composio, you grant read-only scope. The Stripe API itself rejects write commands from this connection. The agent couldn’t modify your data even if it tried.
The worst-case failure mode is a malformed report. Not a deleted customer. Not a corrupted subscription. Not a 10,271-upvote Reddit thread. A bad report is annoying. It’s not a data incident.
That bounded failure mode is exactly why this is the right first workflow if you’re new to AI automation. You get the productivity benefit with essentially zero risk to your underlying data. It’s the training wheels — except the training wheels also save you 4 hours a week. For the full picture on agent security, see our complete security guide.
Data Sources: What Connects and What Gets Pulled
Stripe
Native Composio integration. Pulls MRR, ARR, new subscriptions, churn, net revenue, refunds, and customer counts for the configured period. You define which metrics appear — you’re not locked into a preset. Notably, Stripe launched the Agentic Commerce Suite in early 2026 — a set of APIs designed specifically for AI agents to interact with Stripe data. The ecosystem is moving toward first-class agent support, not away from it.
Google Analytics 4
Native integration via Google OAuth. Sessions, users, bounce rate, top traffic sources, top pages, and conversion events. One caveat: GA4 has a data processing delay of 24–48 hours for some metrics, particularly attribution. If your Monday morning report includes Sunday’s conversion data, it may not reflect all sessions yet. Configure your reporting window to end Friday (not Sunday) to avoid pulling incomplete data.
Google Analytics 4 has a 24–48 hour processing delay for attribution metrics. Set your reporting window to end Friday, not Sunday, to avoid pulling incomplete conversion data.
CRM (HubSpot, Pipedrive, Salesforce)
HubSpot and Salesforce connect natively through Composio with zero custom configuration. Pipedrive requires an API connector setup during deployment — fully supported, just takes additional config time. Pulls pipeline value, new deals, deals closed-won, and deal velocity. Less common CRMs (Attio, Close, Monday Sales CRM) are possible but may require custom integration work. If yours isn’t HubSpot, Pipedrive, or Salesforce, flag it in the intake form so the deployment team can assess before you purchase.
Custom Metrics
Any metric available from your connected data sources can be added. If you track a custom Stripe metric, a specific GA4 event, or a CRM field that isn’t in the standard pull, it gets included during configuration. Metrics from sources without a native Composio integration (a custom internal database, a niche SaaS tool) require custom API work quoted separately.
Manual vs. Automated: The Numbers
| Dimension | Manual | WF-05 Automated |
|---|---|---|
| Time to produce | 4–6 hours/week | 5 minutes/week |
| Consistency | Variable — depends on your schedule | Same format, same timing, every period |
| Data freshness | Up to 2–3 days stale when you’re busy | Pulled at report time — always current |
| Failure mode | Report skipped or delayed when busy | Malformed report at worst — no data risk |
| Monthly cost (your time) | $3,200–$12,000 at founder rates | $5–$15/month in API costs |
| Historical comparison | Requires finding prior period docs manually | Automatic period-over-period comparison |
| What happens on vacation | Report doesn’t happen | Report happens on schedule |
DataStacks Hub reports that executives using BI dashboards for daily decisions jumped from 48% in 2023 to 67% in 2025. The expectation of always-current data is now the norm. Your investors don’t want a PDF 3 days late. Your team doesn’t want to ask “are the numbers ready yet?” on Tuesday.
The automated report isn’t just faster. It’s the one that actually shows up every week.
Prerequisites: What You Need Before Deploying
This is the section most how-to guides skip. Deploying WF-05 without these prerequisites in place produces clean, consistent reports of the wrong things. Garbage in, garbage out — except now the garbage arrives on schedule.
Before You Deploy WF-05
- Defined KPI list with source attribution — exact source (Stripe MRR, not “revenue”), exact definition, comparison period
- GA4 configured with conversion events — check Events section before deployment
- CRM data that’s actually current — automation won’t fix underlying data hygiene
- Agreed report format per audience — founder review vs. investor update vs. daily Slack pulse
A defined KPI list with source attribution. For every metric in the report, you need: the exact source (Stripe MRR, not “revenue”), the exact definition (MRR = active subscription monthly total, not gross revenue), and the comparison period (week-over-week vs. same week last year). “Revenue” means different things in Stripe. Resolve those definitions before setup, not during.
GA4 configured with conversion events. If your Analytics property doesn’t have conversion events set up correctly, the agent pulls sessions and traffic sources but can’t report on goal completions or funnel metrics. Check the Events section in GA4 before deployment — it’ll save setup time.
CRM data that’s actually current. The CRM pull is only as good as the data in your CRM. If your sales team hasn’t been updating deal stages, the pipeline report will be accurate but meaningless. Clean your CRM data first if it’s been neglected — the automation won’t fix the underlying data hygiene problem.
An agreed report format for your audience. Know who receives the report and what they need to see. A founder’s Monday morning review looks different from an investor monthly update, which looks different from a daily sales Slack pulse. If you’re configuring all 3, map them out separately before the deployment session.
If 3 stakeholders define “pipeline” differently — total open deals vs. weighted pipeline vs. deals in proposal stage — resolve that before you tell the agent what to track. Definitional ambiguity produces reports nobody trusts.
What Can Go Wrong (And What Can’t)
Being honest about failure modes is part of choosing the right workflow. Our guide to why AI automation fails covers the full picture. Here are the real failure modes for WF-05:
- Wrong KPIs configured: The most common setup mistake. The agent faithfully reports on what you told it to track. If you configured MRR but your business runs on project revenue with no subscriptions, you’ll get an accurate report of an irrelevant metric.
- Data source API outage: When Stripe or Google has a disruption, the agent delivers a partial report and notes which source failed. You don’t get a silent miss. If you’re on Managed Care, persistent failures trigger a monitoring alert.
- GA4 data latency: Google Analytics 4 has a 24–48 hour processing delay for some metrics. Configure your reporting window to account for this (week ending Friday, not Sunday) to avoid pulling incomplete data.
- Report without interpretation: The agent assembles and formats data. It flags metrics outside thresholds. It doesn’t tell you why churn went up or what to do about it. If your team treats the automated report as full analysis rather than data assembly, that’s an expectation mismatch — not a workflow failure.
- Unsupported billing source: If your subscriptions run through Chargebee, ChartMogul, or a custom billing system rather than Stripe, the standard workflow won’t connect without additional integration work. Flag your billing stack in the intake form.
Here’s what can’t go wrong: data modification. The read-only OAuth scope means the agent can’t change your Stripe subscriptions, modify your CRM records, or mess with your Analytics properties. The failure modes are bounded to the report itself. That’s the architectural advantage of starting with this workflow. For a deeper dive, see the security checklist.
Report Format Options
You configure the output format per report. Run more than one if you need to:
- Slack message: Fast, informal, good for team visibility. Structured message in your chosen channel with key metrics, period-over-period comparisons, and flagged anomalies. Works well for daily or weekly operational cadences.
- Email summary: Structured, deliverable to a distribution list. You configure the recipients — team, co-founder, investors — and the agent formats the report with sections per data source. Good for stakeholder reporting where you want a record.
- Notion page: Writes the report as a structured Notion page in your workspace. Good for teams that do planning and review in Notion and want the data alongside their notes and decisions.
How to Get This Running
Setup for WF-05, assuming your Stripe and GA4 accounts are in good shape, takes 30–45 minutes of the deployment window. The configuration steps:
WF-05 is available on Pro ($1,499) and Business ($2,999) deployments, or as a standalone add-on at $249 for existing OpenClaw installations. Pro includes 3 workflows — reporting alongside email triage and morning briefing runs within the Pro tier without upgrading. If you want to understand the combined time savings across all workflows, the ROI calculator runs the numbers for your team size and hourly rate.
See how reporting compares to client onboarding automation and email and calendar automation in terms of hours saved per week. You can also explore how the full deployment process works or compare ManageMyClaw vs. DIY setup to see if managed deployment is right for you.
The Bottom Line
KPI reporting is the most thankless task a founder does. It produces no new insight. It creates no new revenue. It’s pure assembly work — pulling numbers that already exist in APIs and formatting them for humans. And yet, if you skip it, you’re flying blind. If you do it manually, you’re trading $200–$500/hour founder time for $5–$15/month of agent work.
Your reports should be as reliable as your payroll: automated, consistent, and never dependent on whether you had a busy Monday.
WF-05 is read-only, low-risk, and returns 4–6 hours per week from day 1. It’s the workflow that makes founders comfortable with agent automation — because the first time your Monday report shows up in Slack without you doing anything, you stop thinking of AI agents as experimental. You start thinking of them as infrastructure. And that’s when the bigger workflows become obvious. If you want to understand what an AI agent actually does for a founder, start with why every founder needs an AI agent in 2026.
Frequently Asked Questions
Why is this the safest workflow to deploy first?
Pure read-only access on every data source. The agent queries Stripe, Google Analytics, and your CRM — it can’t write to any of them. Read-only is enforced at the OAuth permission scope level, meaning the Stripe API itself rejects write commands from this connection. If the workflow breaks, your worst case is a malformed report, not a data incident. That bounded failure mode is why this is the right first workflow for teams new to AI automation.
How does it connect to my accounts without storing my credentials?
All connections use Composio OAuth. You authorize each connection once through an OAuth flow — same process as connecting any third-party app to Google — and Composio stores the encrypted token. The agent requests data through Composio. It never holds your API keys or passwords. Revoke the Composio connection at any time to immediately cut the agent’s data access. Think of it as keeping your house keys in a lockbox vs. taping them under the doormat. The agent gets in through the lockbox — and you control the combination.
Can I change what metrics the report includes after setup?
Yes, without reconfiguring the data source connections. The metric definition lives in the workflow prompt — update the prompt, the next report reflects the change. If you’re on Managed Care, the 2 included support hours per month cover configuration updates like this. If not, you can edit the workflow prompt directly through the OpenClaw interface.
Can reports go to different people on different schedules?
Yes. Weekly team Slack summary and monthly investor email are separate report configurations — each with its own cadence, metric selection, and distribution list. Pro supports 2 delivery channels per workflow. Business supports 4. Email delivery is configurable to a distribution list. Slack delivery goes to any channel or DM you configure.
What does it cost to run this workflow?
$5–$15/month. A simple weekly Slack summary from 3 sources runs ~$5–$8/month. A daily report with historical comparisons across 6 data points runs closer to $15/month. Costs cover the AI model calls that synthesize and format the data. They don’t grow over time unless you add more reports or increase cadence. Managed Care plans include quarterly API cost reviews to optimize model selection as cheaper models improve. See full pricing details.
What happens if Stripe or GA4 is down when the report runs?
The agent delivers a partial report and notes which source failed. You don’t get a silent miss. If Stripe’s API is briefly unavailable, the report arrives with GA4 and CRM data plus a note indicating the Stripe pull failed. If you’re on Managed Care, persistent failures trigger a monitoring alert for investigation. You see what broke — you don’t just wonder why the report looks thin.
Do I need technical skills to set this up?
For daily use, no — you talk to the agent in plain language. For DIY deployment, yes: Docker, Linux firewalls, OAuth configuration, and 15+ hours of your time. Services like ManageMyClaw handle the deployment so you get a configured, secured workflow in under 60 minutes without touching a terminal. Starting at $1,499 for Pro, which includes this workflow plus 2 others.