OpenClaw ships 7 updates in 2 weeks. One of them broke Gmail integration for anyone using the Gog skill. Another silently changed the Composio config format with no migration guide. If you’re running without monitoring, you discovered both the hard way: your morning briefing didn’t arrive, or your email triage stopped mid-day.
The worst monitoring strategy is your inbox. You notice something’s broken when the thing that monitors your inbox… stops monitoring your inbox.
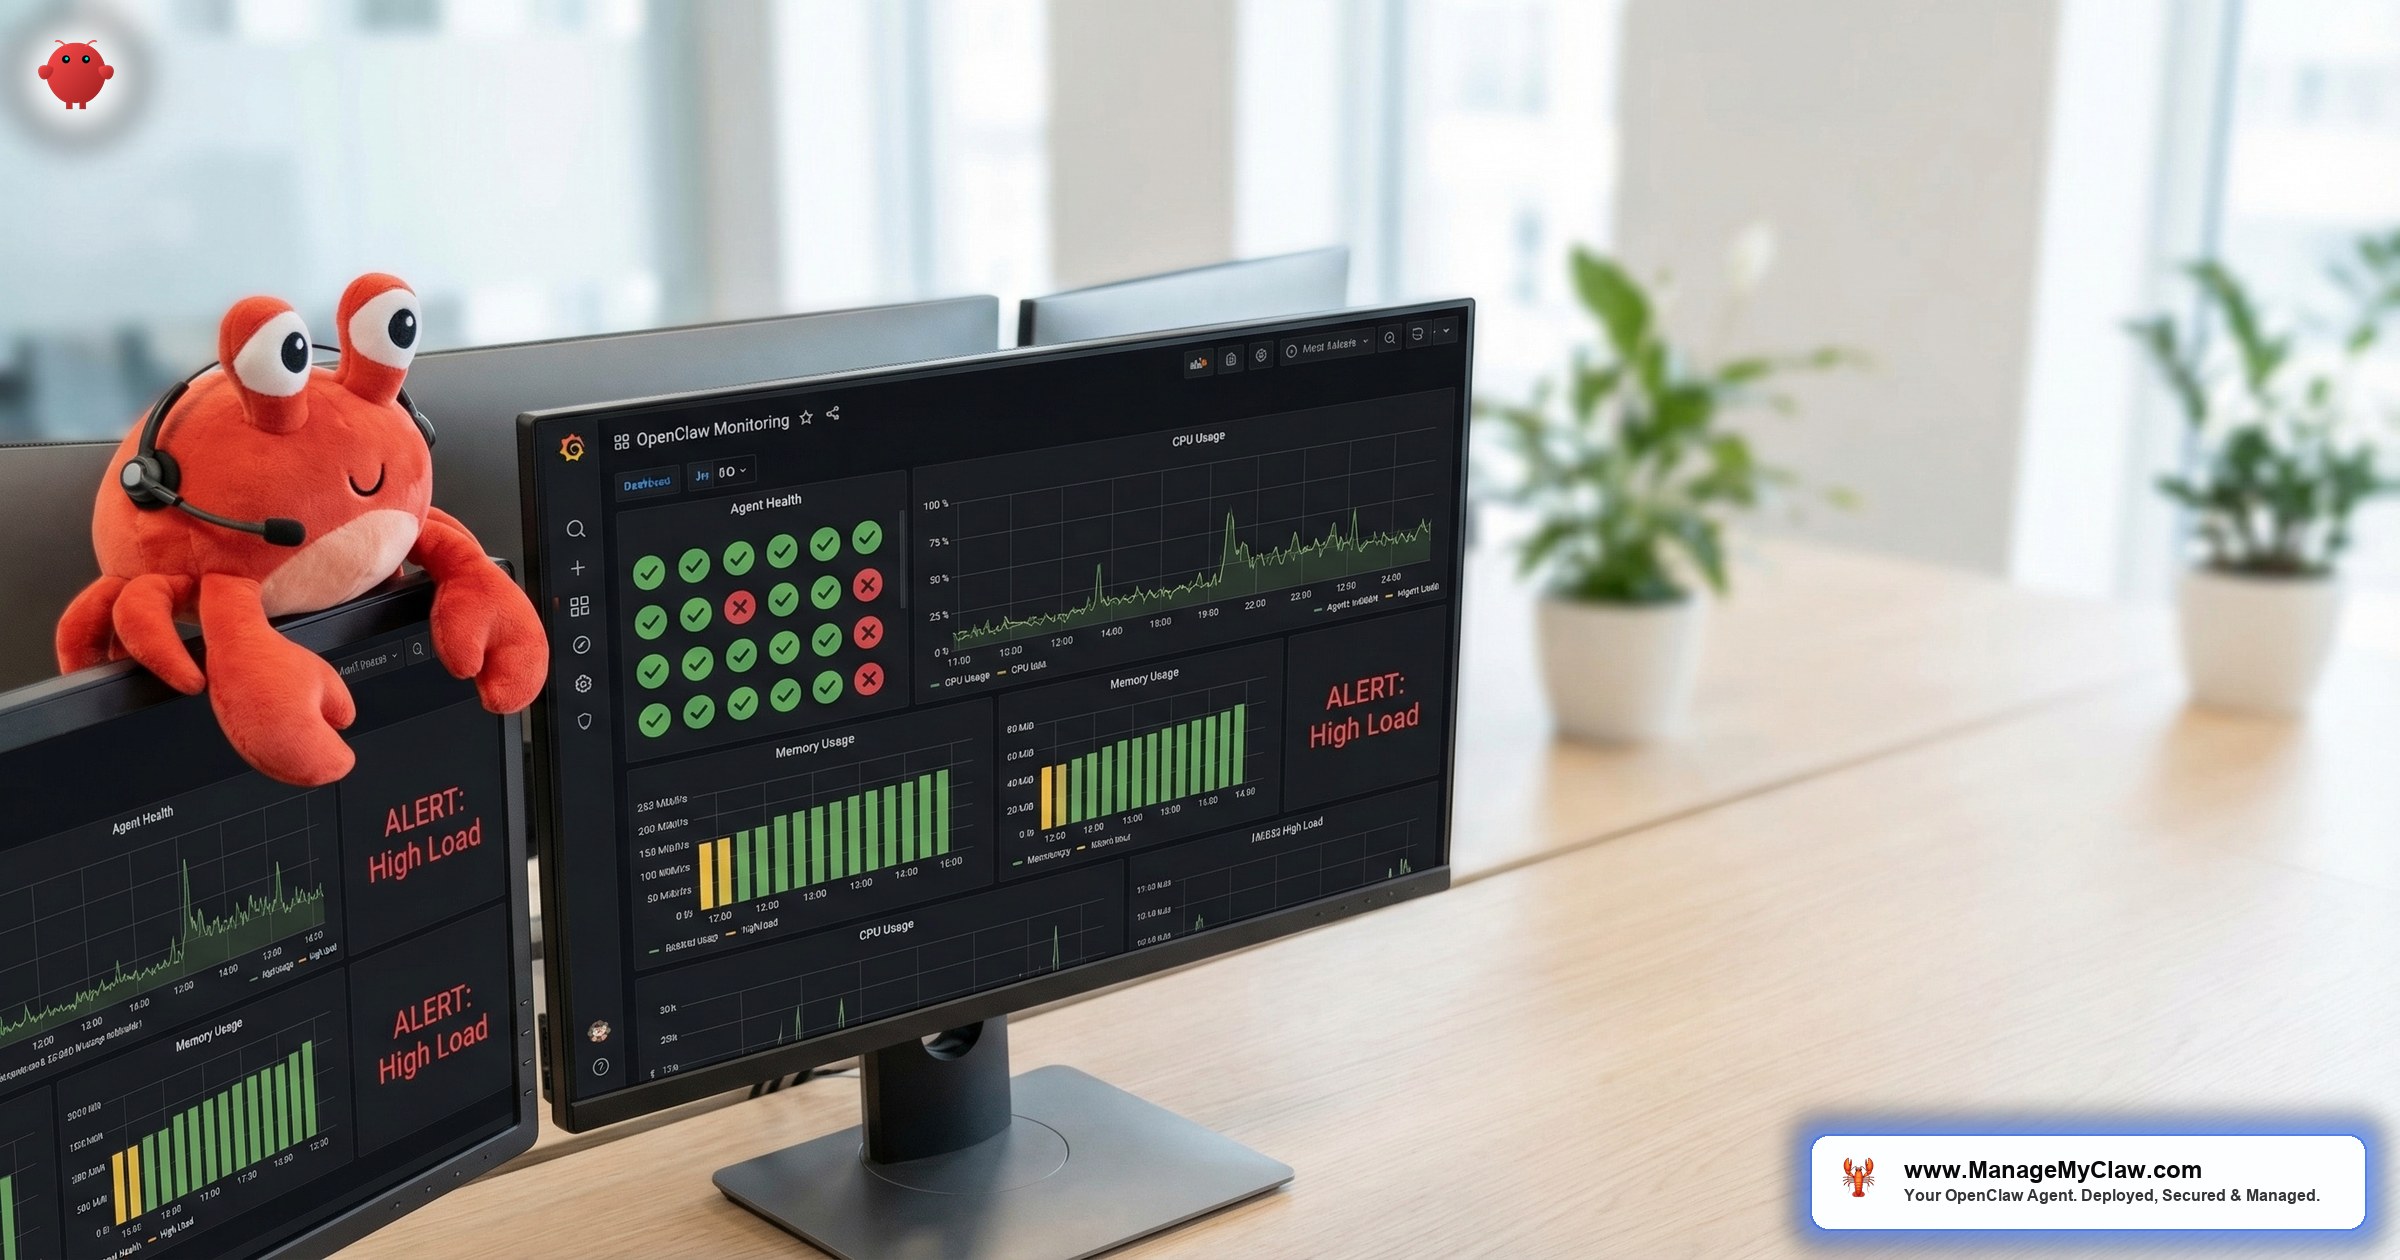
Grafana is the open-source monitoring dashboard that solves this. Combined with Prometheus for metrics collection, it gives you real-time visibility into your OpenClaw agent’s health, API costs, workflow execution rates, error patterns, and resource usage — all in a single dashboard you can check from your phone.
This guide covers the full OpenClaw monitoring Grafana dashboard setup: what to monitor, how to collect the data, and how to configure alerts that catch failures before they affect your workflows.
What to Monitor (and What Most People Miss)
Most monitoring guides focus on server metrics — CPU, RAM, disk. Those matter, but they’re not what tells you your agent is actually working. An OpenClaw instance can be at 10% CPU and completely broken if the API key expired or a config change invalidated your workflows.
Here are the 4 layers that matter for production OpenClaw monitoring:
Layer 1: Infrastructure Health
| Metric | Alert Threshold | Why It Matters |
|---|---|---|
| CPU usage | >80% for 5 min | Sustained CPU spikes indicate runaway processes or resource contention |
| Memory usage | >85% | OpenClaw with context windows can spike memory. OOM kills are silent. |
| Disk usage | >90% | Logs and Docker images fill disks faster than expected |
| Docker container status | Any container not “running” | Container crashes are the #1 cause of silent agent failures |
Layer 2: OpenClaw Process Health
| Metric | Alert Threshold | Why It Matters |
|---|---|---|
| Gateway response time | >5 seconds p95 | Slow gateway = degraded agent performance or upstream API issues |
| Gateway error rate | >5% of requests | Error spikes often follow updates or config changes |
| WebSocket connections | 0 active connections | 0 connections = the agent isn’t talking to anything |
| Process uptime | Reset detected | Unexpected restarts indicate crashes or OOM kills |
Layer 3: Workflow Execution
| Metric | Alert Threshold | Why It Matters |
|---|---|---|
| Cron job execution | Missed scheduled run | Morning briefing didn’t fire = broken workflow |
| Workflow success rate | <90% | Consistent failures indicate config or upstream issues |
| Workflow duration | >2x baseline | Duration spikes often mean the model is struggling or context is bloated |
Layer 4: API Cost Tracking
| Metric | Alert Threshold | Why It Matters |
|---|---|---|
| Daily token consumption | >150% of 7-day average | Runaway loops or context bloat can spike costs overnight |
| Estimated daily cost | >$10/day for standard setup | Cost anomalies catch problems before the API bill does |
| Model fallback rate | >20% | High fallback = primary model is rate-limited or failing |
On r/selfhosted, a thread titled “What’s your monitoring stack for self-hosted AI tools?” (156 upvotes, 93 comments) revealed the split: “Grafana + Prometheus for anything serious. Uptime Kuma if you just want heartbeat checks. But if you’re running something that costs money per API call, you NEED cost monitoring or you’ll get a surprise bill.”
Why this matters: Server metrics alone won’t tell you your agent is working. You need all 4 layers. An agent can be running at 5% CPU with zero active workflows because the cron job silently failed after an update. The 4-layer approach catches failures at the layer they actually occur.
Setting Up the Stack: Prometheus + Grafana
The monitoring stack has 3 components. Prometheus scrapes and stores metrics. Node Exporter exposes system metrics. Grafana visualizes everything and sends alerts. All 3 run as Docker containers alongside your OpenClaw installation.
Docker Compose Configuration
version: "3.8"
services:
  prometheus:
    image: prom/prometheus:latest
    volumes:
      - ./prometheus.yml:/etc/prometheus/prometheus.yml
      - prometheus_data:/prometheus
    ports:
      - "127.0.0.1:9090:9090"
    restart: unless-stopped

  node-exporter:
    image: prom/node-exporter:latest
    ports:
      - "127.0.0.1:9100:9100"
    restart: unless-stopped

  grafana:
    image: grafana/grafana:latest
    volumes:
      - grafana_data:/var/lib/grafana
    ports:
      - "127.0.0.1:3001:3000"
    environment:
      - GF_SECURITY_ADMIN_PASSWORD=your-secure-password
    restart: unless-stopped

volumes:
  prometheus_data:
  grafana_data:
Notice every port binds to 127.0.0.1. Prometheus and Grafana should never be exposed to the public internet. Access them through Tailscale VPN the same way you access the OpenClaw gateway.
Prometheus Configuration
global:
  scrape_interval: 15s

scrape_configs:
  - job_name: "node"
    static_configs:
      - targets: ["node-exporter:9100"]

  - job_name: "openclaw-gateway"
    static_configs:
      - targets: ["host.docker.internal:3000"]
    metrics_path: /metrics

  - job_name: "docker"
    static_configs:
      - targets: ["host.docker.internal:9323"]
The scrape_interval: 15s means Prometheus collects metrics every 15 seconds. For production OpenClaw monitoring, 15 seconds is the right balance between resolution and resource usage. At 5-second intervals, the storage requirements increase significantly without meaningful improvement in alerting speed.
Building the Dashboard
Once Grafana is running, create a dashboard with 4 rows — one per monitoring layer. Here’s the panel layout we use on ManageMyClaw Managed Care deployments:
Row 1 — Infrastructure: CPU gauge, memory gauge, disk usage gauge, network I/O graph. Use the Node Exporter Full community dashboard (ID 1860) as a starting point — it covers 90% of what you need for infrastructure metrics.
Row 2 — OpenClaw Process: Gateway response time (time series), error rate (stat panel), WebSocket connections (gauge), container status (state timeline).
Row 3 — Workflows: Workflow execution timeline (annotations), success/failure rate (bar chart), execution duration trend (time series).
Row 4 — API Costs: Daily token consumption (time series), estimated cost (stat panel), model usage breakdown (pie chart), cost trend over 30 days (time series).
The dashboard should answer 1 question in under 5 seconds: “Is my agent healthy?” If you need to click around to find the answer, the dashboard layout needs work.
Configuring Alerts That Actually Matter
Alert fatigue kills monitoring. If you get 20 alerts a day, you’ll start ignoring them. Here are the 5 alerts that matter for production OpenClaw:
Alert 1: Agent down. If the OpenClaw gateway doesn’t respond to a health check for 2 consecutive minutes, fire an alert. This is the “everything has stopped” alarm. Route it to Telegram, Slack, or email — whatever you check fastest.
Alert 2: Missed cron job. If a scheduled workflow (morning briefing, email triage) doesn’t execute within 15 minutes of its scheduled time, fire an alert. This catches the most common failure mode: silent workflow breakage after an update.
Alert 3: Error rate spike. If the gateway error rate exceeds 10% over a 5-minute window, fire an alert. Error spikes usually follow updates or API provider outages. Catching them early gives you time to roll back before your workflows are affected.
Alert 4: Cost anomaly. If daily token consumption exceeds 200% of the 7-day rolling average, fire an alert. Runaway loops — where the agent gets stuck in a retry cycle — can burn through API credits in hours. This alert is the financial kill switch.
Alert 5: Disk critical. If disk usage exceeds 90%, fire an alert. Docker images, logs, and Prometheus data accumulate. When the disk fills, everything crashes — and the crash generates more logs, creating a cascading failure.
Why this matters: 5 alerts, not 50. Each one maps to an actionable response: restart the container, check the update changelog, review the API provider status page, implement rate limiting, or clean up disk space. An alert without a corresponding action plan is just noise.
Resource Overhead: What Monitoring Costs Your VPS
Prometheus + Node Exporter + Grafana adds approximately 300-500MB of RAM and negligible CPU overhead on a standard OpenClaw VPS (4-8GB RAM). Storage grows at roughly 100-200MB per month at 15-second scrape intervals with 30-day retention.
If you’re on a 4GB VPS, you’ll want to increase to 8GB before adding the monitoring stack — or use a lighter alternative like Uptime Kuma for basic heartbeat checks. For any VPS with 8GB or more, the monitoring stack runs comfortably alongside OpenClaw.
The Bottom Line
An unmonitored agent is a liability. OpenClaw runs 24/7. Updates ship constantly. APIs go down. Config formats change without warning. If you’re relying on “I’ll notice when it breaks,” you won’t — not until the client onboarding that was supposed to fire didn’t, or the morning briefing your team depends on goes silent for 3 days before anyone checks.
Grafana + Prometheus takes 30 minutes to set up and runs on the same VPS as your agent. 4 monitoring layers, 5 alerts, and a dashboard that answers “is my agent healthy?” in under 5 seconds. That’s the monitoring baseline for any production deployment.
Frequently Asked Questions
Can I use Uptime Kuma instead of Grafana for OpenClaw monitoring?
Uptime Kuma is great for basic heartbeat monitoring — is the service up or down? But it doesn’t handle metrics collection, cost tracking, or workflow execution monitoring. For a solopreneur who just wants “alert me if it crashes,” Uptime Kuma works. For production monitoring with API cost tracking and workflow analytics, Grafana + Prometheus is the right tool.
How much additional VPS storage does the monitoring stack require?
With 15-second scrape intervals and 30-day retention, Prometheus uses roughly 100-200MB per month. Grafana itself uses minimal storage. Budget 3-5GB of disk space for a year of monitoring data. Configure Prometheus retention with --storage.tsdb.retention.time=30d to automatically prune old data.
Where should I send Grafana alerts — email, Slack, or Telegram?
Whatever you check fastest. If your OpenClaw agent delivers briefings to Telegram, send monitoring alerts to Slack (so they don’t get mixed up). If your team lives in Slack, use a dedicated #openclaw-alerts channel. Email is the slowest option for time-sensitive alerts like “agent down.” Most operators we work with use Telegram or Slack for critical alerts and email for weekly summary reports.
Does Grafana monitoring work with Mac Mini OpenClaw setups?
Yes. Docker runs on macOS, and the monitoring stack (Prometheus, Node Exporter, Grafana) runs in Docker containers the same way it does on a Linux VPS. The Mac-specific consideration is Node Exporter — the macOS version has fewer metrics than the Linux version. For most monitoring needs, it’s still sufficient.
How does ManageMyClaw Managed Care handle monitoring differently?
Managed Care checks agent health every 5 minutes, monitors for update-related breakage, tracks API costs with quarterly optimization reviews (typical savings: 20-40%), and delivers monthly health reports covering uptime, error rates, workflow execution, and cost allocation. The difference is that we monitor, interpret, and act — not just alert. An alert at 2 AM doesn’t help if nobody knows what to do with it.
Monitoring Without the Setup
ManageMyClaw Managed Care includes 24/7 monitoring, monthly health reports, and quarterly API cost optimization — so your agent runs reliably without you watching a dashboard. Token management is part of the picture too.
Learn About Managed Care