“$3,000–$7,500. That’s what ‘free’ open-source software costs in founder time before your AI agent runs its first task.”
$3,000–$7,500. That’s what “free” open-source software costs in founder time before your AI agent runs its first task. At $200–$500/hour, the 15+ hours of DIY setup aren’t a weekend project — they’re an invoice you’re writing to yourself. Most people don’t do that math until they’re 6 hours deep in a Docker networking issue at 11 PM.
And here’s the number that should bother you more: a February 2026 NBER study of nearly 6,000 executives across the US, UK, Germany, and Australia found that over 80% of companies report zero productivity gains from AI — despite billions in cumulative investment. Not low gains. Zero. Goldman Sachs confirmed the pattern in March 2026, finding “no meaningful relationship between AI and productivity at the economy-wide level” but a median 30% productivity gain in 2 specific, targeted use cases: customer support and software development.
The difference isn’t the technology. It’s whether you did the math on the right tasks first.
This post gives you that math. Not theory — specific break-even calculations at 3 founder hourly rates, the full monthly cost picture, workflow benchmarks from production deployments, and the honest limits of what an OpenClaw ROI calculator should actually include. Track your real numbers for one week before running any of these calculations. Estimates without data aren’t projections — they’re wishful thinking.
Why Most AI ROI Calculations Are Wrong
The 80% failure rate isn’t random. Gartner predicted that 30% of generative AI projects would be abandoned after proof of concept by end of 2025 due to poor data quality, escalating costs, and unclear business value. The companies that beat those odds share one trait: they calculated ROI on specific, measurable workflows before deploying — not after.
“One thing we didn’t appreciate early on was that the real product isn’t the automation — it’s the maintenance model. Anyone can build a workflow that works once. The hard part is building something that keeps working.”
— Top comment (47 upvotes), r/AI_AgentsThat’s the gap most ROI calculators miss entirely. They model the savings from automation but ignore the ongoing cost of keeping it running — updates that break workflows, API costs that scale with usage, and security patches you can’t skip. This calculator includes all of it.
If you’re building an ROI case for OpenClaw, the number that matters isn’t “how much time could AI save?” It’s “how much time will this specific workflow save at my actual hourly rate, minus all real costs, over 12 months?” Everything below answers that question.
The 5 Inputs You Need Before Any Calculation
Don’t estimate these. Track them for a real week. Overestimating any one of them makes your ROI projections worthless.
- Your effective hourly rate — founder range is $200–$500/hr. Use the number that reflects what your time actually produces, not what you charge clients.
- Hours per week on automatable tasks — email processing, pulling KPI data, scheduling, client onboarding admin, social content. Only count tasks that repeat on a consistent trigger and produce a defined output.
- Daily email volume — how many emails hit your inbox on an average day. McKinsey found 28% of the average workweek goes to email. That’s 11+ hours for a standard 40-hour week.
- Weekly reports you build manually — KPI pulls, client summaries, team updates. Count the time from data access to formatted output.
- Clients onboarded per month — and current time per onboarding. 2 hours per client at 10 clients per month is 20 hours — at $200/hr, that’s $4,000/month sitting in a workflow that can be cut to 10 minutes per client.
HBR and Deloitte research puts 41% of executive time on delegatable tasks. If you’re spending meaningful hours on email, reporting, and onboarding admin, you’re almost certainly in that bucket.
“Think of it this way: hiring an assistant who works 24/7 and costs less than your monthly coffee budget isn’t the hard part. The hard part is knowing exactly which tasks to hand them — and which ones to keep.”
— The founder automation paradoxTime Recovered Per Workflow: Production Benchmarks
These aren’t projections. They’re benchmarks from deployed workflows running in production. Map them against your own time inputs from the exercise above.
| Workflow | Before | After | Monthly API Cost |
|---|---|---|---|
| Email Triage | 2+ hrs/day | ~25 min/day | $15–$40 |
| Morning Briefing | 5 app checks/day | 1 message | $5–$15 |
| Client Onboarding | 2 hrs/client | 10 min/client | $10–$30 |
| KPI Reporting | 4–6 hrs/week | 5 min/week | $5–$15 |
| Social Pipeline | Manual per post | Fully automated | $10–$25 |
| Customer Service Bot | 100% manual | 20% manual | $30–$80 |
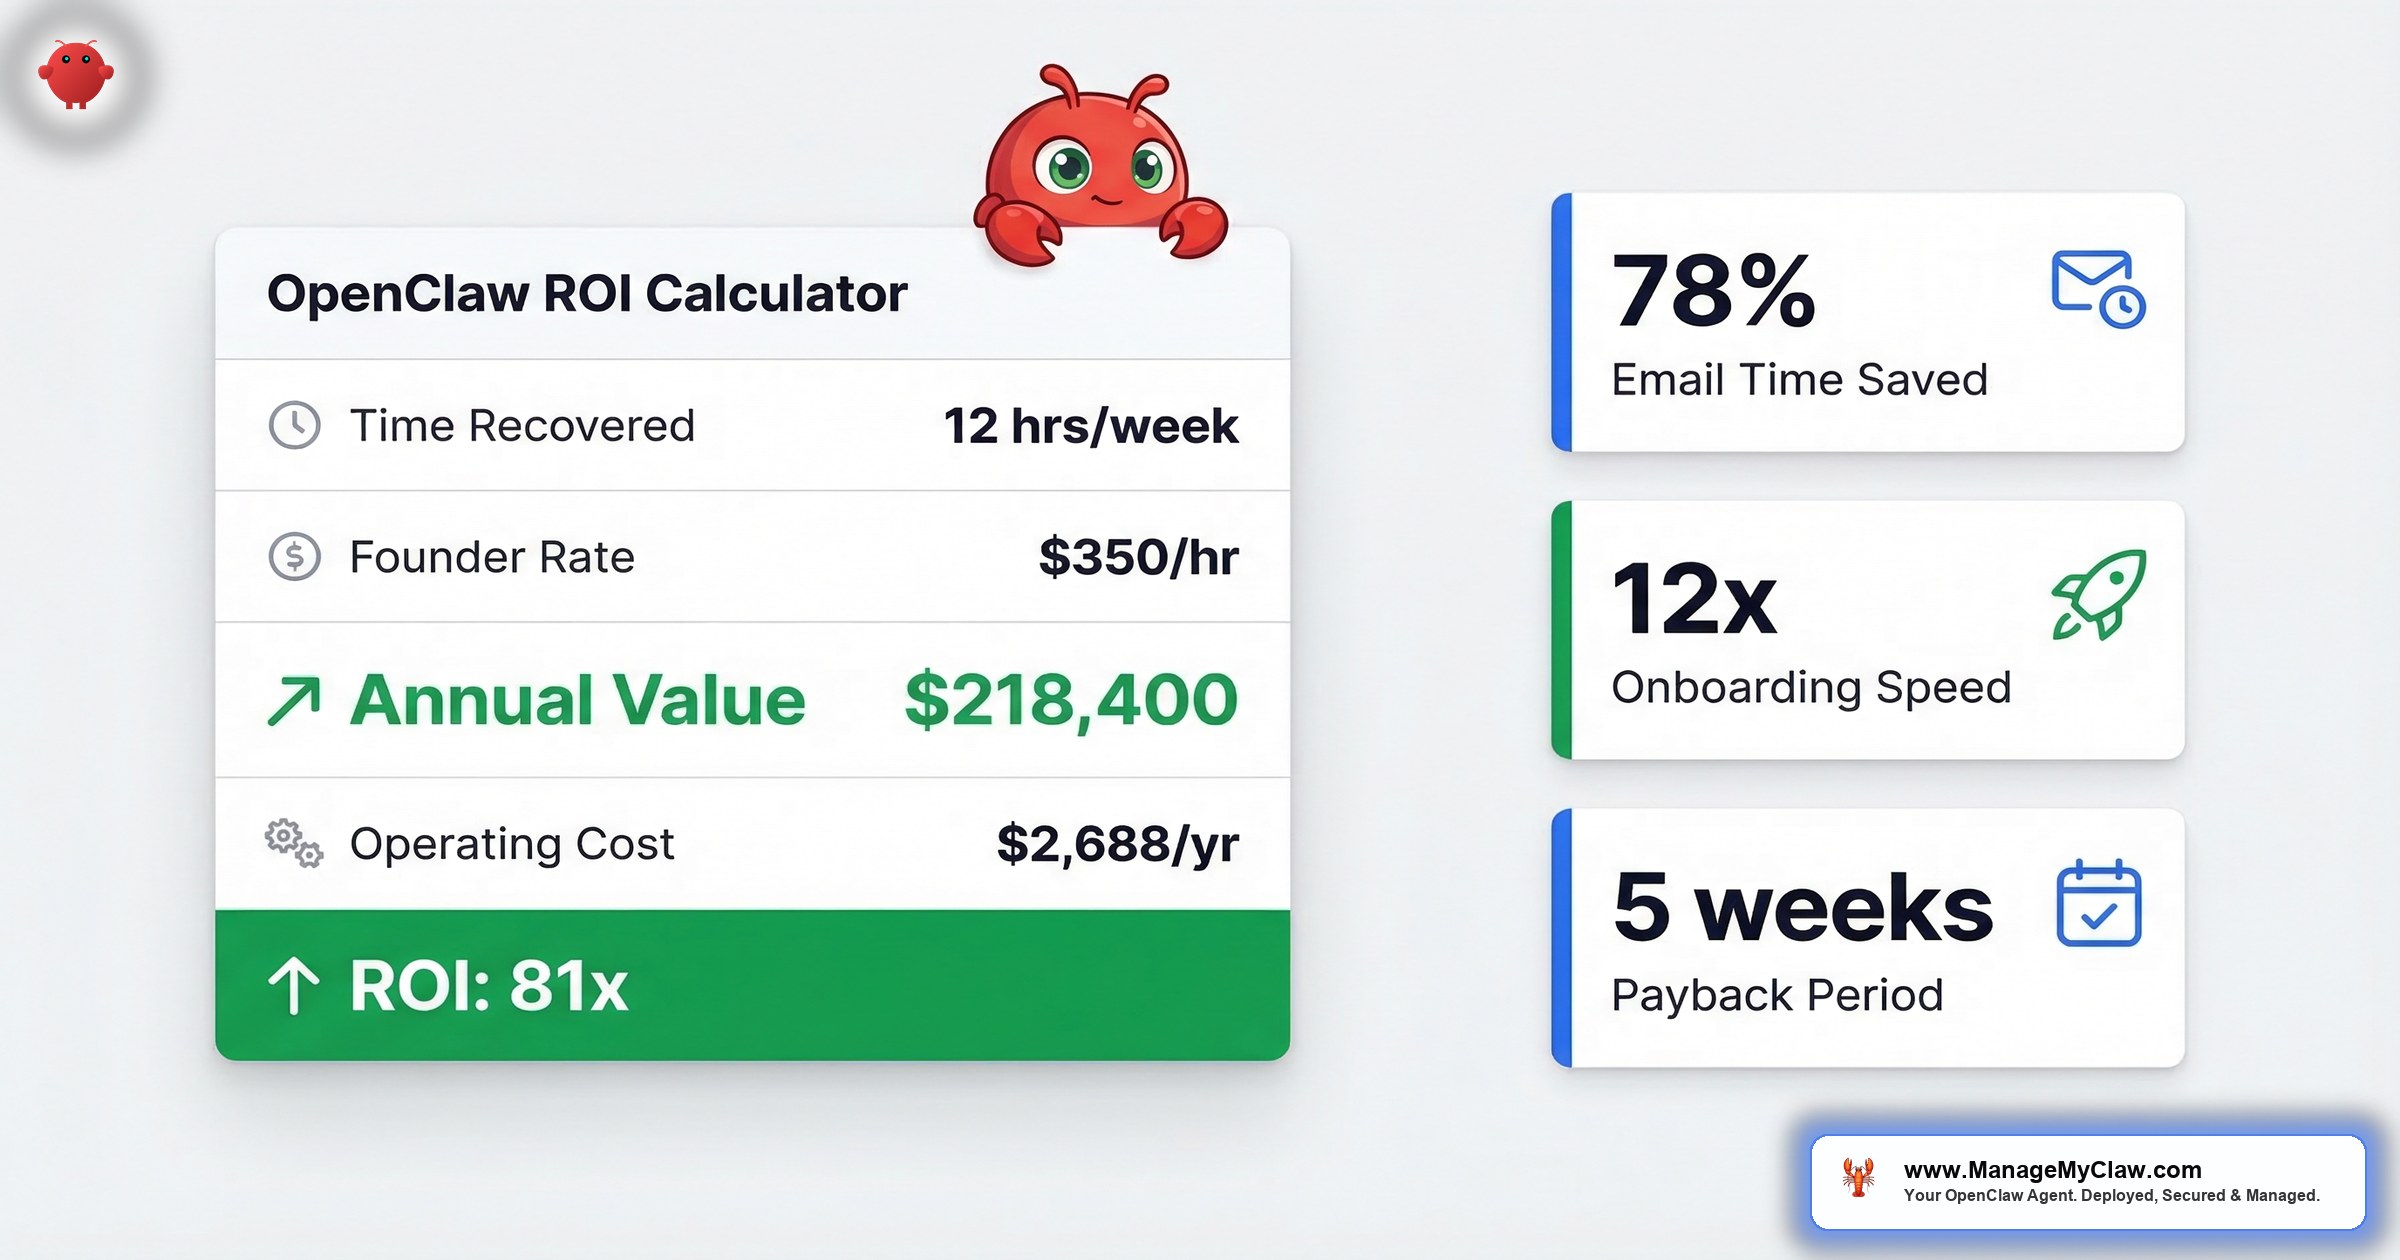
The email triage benchmark — 78% time reduction — is the most commonly cited because it’s the workflow most founders deploy first. At 2 hours/day before and ~25 minutes/day after, that’s 7.8 hours recovered per week. The full email and calendar automation guide covers configuration details and the security constraints that prevent another inbox-wipe incident.
These benchmarks are the numerator in your ROI calculation. If you can’t find at least one workflow where you’re spending 5+ hours per week on repeatable tasks, the ROI math won’t be compelling enough to justify deployment. Start with the biggest time sink, not the most exciting automation.
Break-Even at 3 Founder Rates
Here’s the math at 3 realistic founder profiles. Each uses one primary workflow as the main ROI driver and includes all monthly operating costs. The calculations use conservative time savings — not best-case benchmarks.
Profile A: $200/hour — Email-Heavy Founder
Spending 2 hours/day processing email. The 78% benchmark would recover 7.8 hrs/week. Using a conservative 50% reduction instead: 5 hours/week recovered.
| Line Item | Amount |
|---|---|
| Weekly value recovered (5 hrs × $200) | $1,000/week |
| Monthly value (4.3 weeks) | $4,300/month |
| Setup cost (Starter tier) | $499 |
| Monthly operating (VPS $12–24 + email API $15–40) | $27–$64/month |
| Break-even: $499 ÷ $4,300/month | 3.5 days |
Profile B: $350/hour — Reporting-Heavy Operator
Building KPI reports manually — 5 hours/week from data access to formatted output. Automation drops that to 5 minutes.
| Line Item | Amount |
|---|---|
| Time recovered (5 hrs minus 5 min) | 4.9 hrs/week |
| Weekly value (4.9 hrs × $350) | $1,715/week |
| Monthly value (4.3 weeks) | $7,375/month |
| Setup cost (Pro tier) | $1,499 |
| Monthly operating (VPS + reporting API $5–15) | $17–$39/month |
| Break-even: $1,499 ÷ $7,375/month | Under 6 days |
Profile C: $500/hour — High-Volume Client Business
10 clients onboarded per month. Each currently takes 2 hours. Automation cuts it to 10 minutes per client.
| Line Item | Amount |
|---|---|
| Time saved per client (2 hrs − 10 min) | 1.83 hrs |
| Monthly time saved (10 clients × 1.83 hrs) | 18.3 hrs |
| Monthly value (18.3 hrs × $500) | $9,150/month |
| Setup cost (Pro tier) | $1,499 |
| Monthly operating (VPS + onboarding API $10–30) | $22–$54/month |
| Break-even: $1,499 ÷ $9,150/month | First 5 days of month 1 |
These break-even timelines are aggressive compared to industry baselines. Deloitte’s 2026 State of AI report found that enterprise AI deployments typically reach payback in 6–18 months. OpenClaw’s break-even is faster because the setup cost is a fraction of enterprise platforms ($499–$2,999 vs. $5 million–$20 million per Gartner’s estimates), and you’re measuring against founder-rate hours, not blended corporate labor.
These calculations use conservative inputs. If your actual time savings are closer to the benchmarks — 78% for email, 12x for onboarding — the break-even compresses further. But even at half the benchmark, every profile breaks even within the first week. The question isn’t whether it pays for itself. It’s which week.
The 60x ROI Calculation: Full Math for a 5-Person Team
This is the calculation that gets cited most — and most misunderstood. It models what happens when a 5-person team runs all 5 primary workflows simultaneously. Here’s every step, so you can verify the math yourself.
| Variable | Value |
|---|---|
| Team members | 5 |
| Hours/day on automatable tasks per person | 2 |
| Working days/month | 20 |
| Monthly hours recovered (5 × 2 × 20) | 200 hours |
| Blended team rate | $75/hour |
| Monthly value recovered (200 hrs × $75) | $15,000 |
| Setup cost (Business tier) | $2,999 |
| Monthly operating (all workflows) | ~$210 |
| Month 1 net value ($15,000 − $2,999 − $210) | ~$11,791 |
| Return on setup fee ($15,000 ÷ $2,999 in gross month 1 value) | ~5x net / ~60x gross annualized |
The key driver isn’t the setup fee — it’s the compounding across people and workflows. Email triage alone on a 5-person team recovers more monthly time value than the entire Business tier setup costs.
“To put that in perspective: the setup cost is less than what most teams spend on project management software per year. Except the project management software doesn’t give you back 200 hours a month.”
— The compounding math of team automationFor enterprise context: DigitalOcean’s February 2026 survey of 1,100+ developers, CTOs, and founders found an average 171% ROI across enterprise AI deployments, with 9% of respondents reporting 75%+ productivity gains. The 60x figure isn’t a marketing number — it’s the output of specific math at specific inputs. Your number depends on your inputs.
What It Actually Costs to Run Every Month
“Open-source” means no software licensing fee. It doesn’t mean free to operate. Here’s the complete monthly picture — because this is where most self-managed deployments bleed money without realizing it.
| Cost Component | Monthly Range | Notes |
|---|---|---|
| VPS hosting | $12–$24 | Hetzner, DigitalOcean, Vultr |
| Morning briefing API (WF-01) | $5–$15 | Lightest workflow; read-only |
| Email triage API (WF-02) | $15–$40 | 50 emails/day ≈ $20/month |
| Client onboarding API (WF-03) | $10–$30 | 10 clients/month ≈ $15/month |
| Social pipeline API (WF-04) | $10–$25 | 3–5 posts/week ≈ $15/month |
| KPI reporting API (WF-05) | $5–$15 | Weekly reports ≈ $8/month |
| Customer service bot API (WF-06) | $30–$80 | 50 conversations/day ≈ $50/month; heaviest |
| Total (all 6 workflows) | $87–$229/month | Most founders: $80–$130/month on 2–3 workflows |
“This in many cases is completely false. Automating many tasks in accounting at one of my clients has saved hundreds of overtime hours and the ROI is measurable.”
— Top comment (r/AI_Agents, replying to “Automation will not reduce your payroll”)Both sides are right. Automation shifts cost from labor to infrastructure. But at $80–$130/month in operating costs versus $2,580+/month in recovered time value (at $200/hr with 3 hours/week saved), the shift heavily favors automation. The ratio stays favorable at nearly any hourly rate above $50/hr.
One hidden cost to watch: DigitalOcean’s 2026 survey found that 49% of respondents cite high inference costs as the top blocker to scaling AI agents, with nearly half spending 76–100% of their AI budget on inference alone. That’s what makes the monthly cost table above critical. Your API spend isn’t fixed — it scales with usage. Managed Care includes quarterly API cost optimization specifically for this reason, with typical savings of 20–40% after the first review.
If you’re evaluating OpenClaw, the monthly cost table is the denominator in your long-term ROI equation. The setup fee is one-time. These costs are permanent. Plan for them.
Year 1 Total Cost of Ownership: The Full Accounting
Here’s what the complete Year 1 cost looks like for a solo founder on Starter + Managed Care — the most common profile:
| Cost | Amount |
|---|---|
| Setup (Starter tier) | $499 |
| Managed Care (12 months × $299) | $3,588 |
| Hosting + API (12 months × ~$100 avg) | $1,200 |
| Total Year 1 all-in | ~$5,287 |
Compare that to DIY. Setting it up yourself takes 15+ hours. At $200/hr, that’s $3,000–$7,500 in founder time before a single automation runs. And that doesn’t include the ongoing debugging, updates, and security patching. The full DIY vs. managed cost comparison breaks down where the 15+ hour estimate comes from and what ongoing maintenance realistically costs.
Once deployed, a founder at $200/hr recovering 3 hours/week generates $2,580/month in time value. The entire $5,287 Year 1 cost is recovered in roughly 10 days of operation at that rate. By month 12, you’ve returned approximately 6x your total Year 1 investment — from one workflow.
That’s the math that makes “free” open-source the most expensive option on the table. Not because the software costs money — because your time does. Read the founder AI agent guide for the full case.
What OpenClaw Can’t Automate (and Where the ROI Falls Apart)
The ROI math only holds when you apply automation to the right tasks. Automate the wrong ones and you don’t get 60x return — you get cleanup work, lost trust in the system, and a much harder sell internally the next time you try to deploy anything. OpenClaw performs reliably on repeatable, structured-input, defined-output work. It doesn’t belong anywhere near:
- Hiring decisions — assessing a candidate requires context, intuition, and organizational knowledge an agent can’t reliably hold
- Strategic direction — setting next quarter’s priorities or deciding which market to enter aren’t pattern-matching problems
- Relationship-sensitive communications — difficult conversations, negotiations, escalations
- Novel creative work — original positioning, brand voice, product naming
- Anything with delete access before trust is earned — the full breakdown of why AI automation fails covers the specific failure modes
“The reason small businesses are seeing such a massive advantage isn’t just because they have access to the same brains (LLMs) as big companies, but because they can move faster on the orchestration.”
— Top comment (105 upvotes), r/AI_Agents, “What is your full AI Agent stack in 2026?”That’s the real advantage. Not the AI itself — the speed at which you can deploy it against the right problem.
Every hour of ROI in this calculator assumes you’re automating work that belongs on the list — email triage, KPI pulls, onboarding sequences, briefings. The moment you push automation into judgment-heavy territory, the math reverses. Guard the boundary. See the 5 security layers guide for the permission lockdown that prevents agents from overstepping.
The Bottom Line
80% of companies report zero productivity gains from AI. The other 20% calculated ROI on specific workflows before they deployed. That’s the entire difference.
The math isn’t complicated. Your hourly rate times hours recovered, minus setup and operating costs, over time. At $200/hr with email triage alone, the Starter tier breaks even in 3.5 days. A 5-person team on the Business tier returns ~60x the setup fee in Year 1. These aren’t aspirational projections — they’re arithmetic. The numbers either work for your situation or they don’t, and this post gives you every input to find out.
Break-Even Formula:
setup_cost / (hourly_rate * weekly_hours_saved * 4.3) = months_to_break_even

Example (Starter tier, $200/hr, 5 hrs/week):
$499 / ($200 * 5 * 4.3) = $499 / $4,300 = 0.12 months = ~3.5 days
The ROI isn’t in the AI. It’s in knowing which 5 hours of your week to hand it.
ManageMyClaw exists because the math works — but only if the deployment is done right. Docker sandboxing, firewall hardening, Composio OAuth, tool permission lockdown, and the right workflows selected for your specific business. The founders who win with OpenClaw aren’t the ones who deployed fastest. They’re the ones who ran the calculator first. See how the deployment process works step by step.
Frequently Asked Questions
How do I calculate my personal break-even point?
Divide your total setup cost by your monthly time value recovered. Here’s the formula: setup cost ÷ (hourly rate × weekly hours saved × 4.3). Concrete example: $499 ÷ ($200 × 5 hrs × 4.3) = $499 ÷ $4,300 = 0.12 months, or about 3.5 days. Adjust the hourly rate and weekly hours for your actual numbers. Most founders at $200+/hr with at least one high-frequency workflow break even in the first week.
What are the monthly operating costs, honestly?
$80–$130/month for most founders running 2–3 workflows. That’s VPS hosting ($12–$24) plus LLM API costs for the workflows you’re actually running. The customer service workflow is the heaviest at $30–$80/month because it processes the most tokens. If you run all 6, the ceiling is $229/month. Quarterly API cost optimization — included in Managed Care — typically cuts these 20–40% after the first review.
Is the 60x ROI figure realistic if I’m a solo founder?
No — and that’s the honest answer. The 60x figure is the gross return on setup investment for a 5-person team running 5 workflows in month 1. That’s a specific calculation, not a general claim. Solo founders typically see 5–15x net return in month 1, compounding as workflows are added. Still extremely favorable — just don’t compare your one-workflow setup to the team scenario.
Does OpenClaw replace my team or free them up?
It frees them up. The 78% email time reduction still leaves 22% requiring human judgment — complex negotiations, relationship management, strategic replies. The agent handles triage, categorization, drafting, and routing. Your team handles what only your team can handle. Think of it as giving your best people permission to stop doing their worst tasks.
Which plan do I need to start seeing ROI?
Starter ($499) deploys 1 workflow and is enough for most founders to break even inside the first week. If your primary time sink is KPI reporting or client onboarding, Pro ($1,499) covers 3 workflows and is typically break-even within the first month at $200+/hr. See the pricing page to match your use case to the right tier.
What if my hourly rate is under $200?
The math still works — it just takes longer. At $100/hr with 5 hours recovered weekly, the Starter tier breaks even in about a week instead of 3.5 days. At $50/hr, break-even stretches to roughly 2 weeks. The threshold where the economics stop making sense is around $30/hr with fewer than 3 hours/week recovered — at that point, the operating costs eat too much of the savings. Below that, focus on process improvements before adding automation.