“The property owner doesn’t care how many guest messages you answered this month. They care about 3 numbers: revenue in, expenses out, and net profit deposited. If you can’t produce those numbers in a clean report within 48 hours of month-end, you’re losing trust you don’t know you’re losing.”
AI revenue reports for property owners are automated financial summaries generated by an AI agent that compiles booking data, operating expenses, and performance metrics into formatted reports delivered to property owners on a recurring schedule. OpenClaw is an open-source AI agent framework with 250,000+ GitHub stars that runs on your own server via bare-metal deployment managed by systemd, connects to your email and booking data through Gog OAuth, and produces monthly financial reports covering revenue by property, expense breakdowns, net operating income, occupancy trends, ADR (average daily rate), and RevPAR (revenue per available room) — all without you opening a spreadsheet.
This guide covers the specific financial metrics that belong in an owner revenue report, how OpenClaw calculates each one from your booking data, what a finished report looks like, and why property managers who automate financial reporting retain owners at 2x the rate of those who don’t. If you’re spending 3–4 hours per month per property compiling revenue summaries, you’re about to get those hours back.
Revenue reporting shouldn’t be a monthly emergency where you scramble through spreadsheets the night before owner calls. It should be a system that runs itself while you focus on the work that actually grows your portfolio.
The 8 Financial Metrics Every Property Owner Revenue Report Needs
Property owners invest in short-term rentals for returns. Your revenue report needs to show them those returns clearly, with enough detail to build confidence but not so much detail that it becomes overwhelming. Here are the 8 metrics that should appear in every monthly revenue report:
1. Gross Booking Revenue
Total income from all completed bookings during the reporting period, before any deductions. This is the top-line number owners look at first. OpenClaw calculates it by summing the booking values from Airbnb, VRBO, and Booking.com confirmation and payout emails. For a property generating $4,200/month across 12 bookings, the report shows $4,200 with a line item per booking (dates, platform, nightly rate, total).
2. Platform Fees
Airbnb takes 3% (host-only fee) or splits 14.2% with the guest. VRBO charges 5%. Booking.com takes 15%. These fees reduce the owner’s income, and they should see exactly how much each platform costs them. OpenClaw extracts fee amounts from payout notification emails and calculates them as a percentage of gross revenue for each platform.
3. Cleaning Costs
Total cleaning expenses for the month, broken down by turnover. If you charge guests a cleaning fee, the report shows both the fee collected and the actual cleaning cost. The difference is either profit or subsidy, and owners should see which one it is. OpenClaw pulls cleaning invoice amounts from your email correspondence with cleaning crews.
4. Maintenance Expenses
Every repair, replacement, and preventive maintenance item for the month, with individual line items and costs. The broken dishwasher handle ($45), the HVAC filter replacement ($28), the emergency plumber visit ($175). Owners hate surprises. Itemized maintenance in the monthly report means no surprise phone calls when the quarterly statement arrives.
5. Management Fee
Your commission, clearly stated as both a percentage and a dollar amount. Transparency here is non-negotiable. If you take 20% of $4,200, the report shows $840 management fee. Owners respect clarity. They resent ambiguity.
6. Net Operating Income (NOI)
Gross revenue minus platform fees, cleaning costs, maintenance, and management fee. This is the number that gets deposited into the owner’s account. It’s the most important line in the report, and it should be prominently displayed. OpenClaw calculates it automatically from the 5 components above.
NOI = Gross Revenue – Platform Fees – Cleaning Costs – Maintenance – Management Fee
Example: $4,200 – $126 – $480 – $248 – $840 = $2,506 net to owner
7. ADR (Average Daily Rate)
Total booking revenue divided by total booked nights. If the property earned $4,200 across 24 booked nights, the ADR is $175. This metric tells owners whether pricing is optimized. A declining ADR might mean you’re discounting too aggressively. A rising ADR with stable occupancy means pricing strategy is working. OpenClaw calculates ADR from booking confirmation data (nightly rates x nights per booking).
8. RevPAR (Revenue Per Available Room)
Total booking revenue divided by total available nights (not just booked nights). If the property earned $4,200 across 30 available nights, RevPAR is $140. This metric combines occupancy and rate into a single performance indicator. It’s the standard the hotel industry uses, and sophisticated property owners will expect to see it.
Most property managers report gross revenue and maybe net profit. The ones who report ADR, RevPAR, and month-over-month trends are the ones who keep their contracts. You’re not just showing numbers — you’re showing competence.
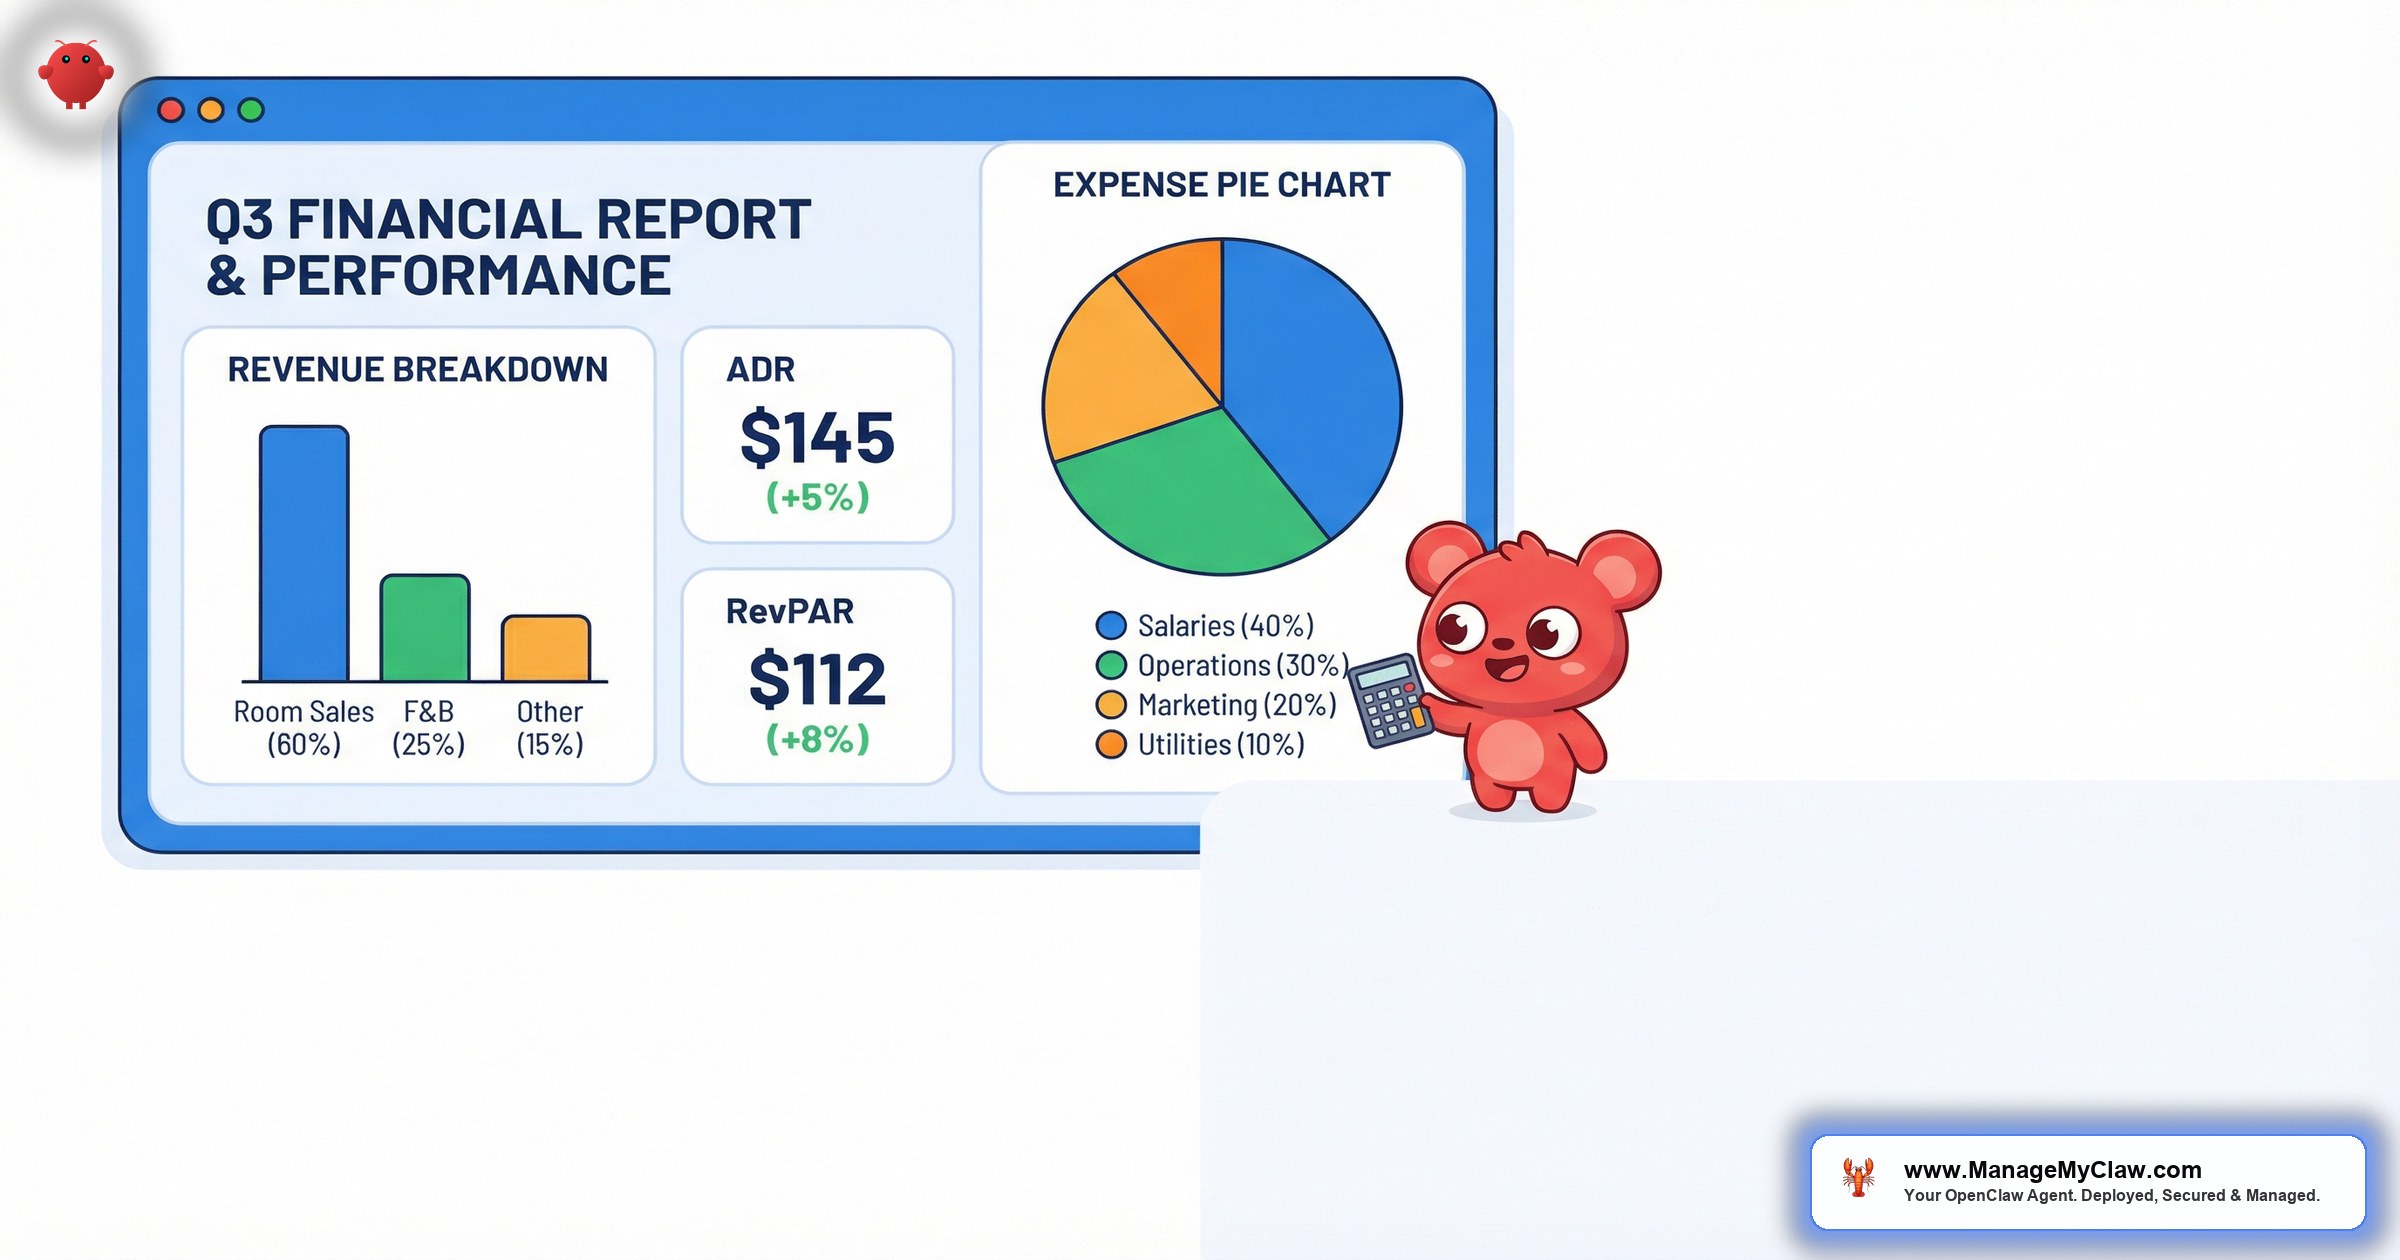
What an OpenClaw Revenue Report Looks Like
Here’s a sample monthly revenue report for a single property, as generated by OpenClaw and delivered to the property owner’s inbox on March 1:
| Monthly Revenue Report — Lakewood Cabin — February 2026 | |
|---|---|
| Occupancy | 22 / 28 nights (78.6%) |
| Total Bookings | 8 completed stays |
| Gross Revenue | $5,280.00 |
| Platform Fees | –$158.40 (Airbnb 3%) |
| Cleaning Costs | –$640.00 (8 turnovers x $80) |
| Maintenance | –$175.00 (furnace filter $28, broken cabinet hinge $47, snow removal $100) |
| Management Fee (20%) | –$1,056.00 |
| Net to Owner | $3,250.60 |
| Performance Metric | This Month | Last Month | Trend |
|---|---|---|---|
| ADR | $240.00 | $218.00 | +10.1% |
| RevPAR | $188.57 | $165.70 | +13.8% |
| Occupancy Rate | 78.6% | 76.0% | +2.6 pts |
| Avg. Guest Rating | 4.9 / 5.0 | 4.8 / 5.0 | +0.1 |
The report also includes a booking detail section (each stay with dates, guest name, platform, and revenue) and a looking ahead section (confirmed bookings for next month with estimated revenue). The entire email takes the owner under 3 minutes to read and tells them everything they need to know.
Compare that to the owner who calls you and asks “So… how was February?” and you spend 15 minutes pulling numbers from Airbnb’s dashboard, your cleaning spreadsheet, and your maintenance log while they wait on the phone. One approach communicates competence. The other communicates disorganization.
How OpenClaw Calculates Each Metric from Your Data
The calculation engine runs on data already flowing through your email inbox. OpenClaw doesn’t require API connections to Airbnb or a separate accounting system. It reads the emails you already receive:
| Metric | Data Source | Calculation |
|---|---|---|
| Gross Revenue | Booking confirmation + payout emails | Sum of all booking totals for the period |
| Platform Fees | Payout detail emails | Gross revenue – net payout amount |
| Cleaning Costs | Cleaner invoice/confirmation emails | Sum of cleaning charges per turnover |
| Maintenance | Vendor invoices + maintenance correspondence | Sum of itemized repair/service costs |
| Management Fee | SOUL.md configuration (fee percentage) | Gross revenue x management fee rate |
| NOI | Calculated | Gross – fees – cleaning – maintenance – mgmt |
| ADR | Booking confirmations | Gross revenue / total booked nights |
| RevPAR | Booking confirmations + calendar | Gross revenue / total available nights |
The agent processes all of these calculations on the 1st of each month (or whatever schedule you configure) and generates the report within minutes. For 15 properties, all 15 reports are generated and sent in a single batch — each owner receives only their own property’s data.
OpenClaw can only report on data that arrives in your inbox. If your cleaning crew invoices by phone call instead of email, that line item will show as “pending manual entry.” The fix is simple: ask vendors to send invoices by email (most already do). The more data flows through email, the more complete and accurate the automated report becomes.
Multi-Property Revenue Reports: The Portfolio Summary
For owners with multiple properties in your portfolio, OpenClaw generates a consolidated report that shows all their properties side by side. This is where the reporting gets genuinely valuable — because cross-property comparison reveals insights that single-property reports can’t.
| Property | Occupancy | Gross Rev | NOI | ADR | RevPAR |
|---|---|---|---|---|---|
| Lakewood Cabin | 78.6% | $5,280 | $3,251 | $240 | $189 |
| Metro Studio 4B | 86.7% | $3,900 | $2,418 | $150 | $130 |
| Harbor View Unit 12 | 71.4% | $6,100 | $3,782 | $305 | $218 |
| Portfolio Total | 78.9% avg | $15,280 | $9,451 | $232 avg | $179 avg |
An owner looking at this table immediately sees that Harbor View has the highest ADR but the lowest occupancy, which might mean the pricing is too high for the market. Metro Studio has the best occupancy but the lowest rate, suggesting there’s room to increase nightly pricing. These insights happen naturally when the data is presented side by side — and they make you look like a strategic partner, not just a property babysitter.
The portfolio view is also your best retention tool. When an owner sees 3 properties generating $9,451/month in net income, neatly tracked with trends, they don’t question your management fee. They add a 4th property.
For the full owner communication strategy — including weekly operational updates and quarterly strategic reviews — read our owner communication automation guide.
Occupancy Trends, ADR Movement, and Seasonal Analysis
A single month’s numbers tell you what happened. Trend data tells you why it happened and what’s coming next. OpenClaw’s quarterly and annual reports include trend analysis across 4 dimensions:
Occupancy Trends
Month-over-month occupancy rate plotted over the past 6–12 months. This reveals seasonal patterns that inform pricing strategy. A lakefront cabin with 90% occupancy in July and 40% in January needs a different rate strategy for each season. The trend data makes that obvious to the owner, and it gives you the basis for a pricing conversation that’s backed by data instead of opinion.
ADR Movement
Average daily rate tracked monthly. ADR should increase during peak seasons and may decrease during shoulder seasons if you’re using dynamic pricing. The report shows the owner whether their property is commanding higher rates over time — a key indicator of listing quality, review score, and market positioning.
RevPAR Trajectory
RevPAR combines occupancy and ADR into a single number, making it the best overall performance metric. A property can have high occupancy with low ADR (cheap and full) or low occupancy with high ADR (expensive and empty). RevPAR tells you which combination is actually making the most money. If RevPAR is climbing quarter over quarter, the investment is performing. If it’s flat or declining, something needs to change.
Expense Ratio
Total operating expenses as a percentage of gross revenue, tracked over time. A healthy STR typically runs at 35–50% expense ratio (including management fees). If expenses are creeping up — maybe cleaning costs increased or maintenance is getting more frequent — the trend data flags it before it becomes a problem.
Trend data is the difference between “your property earned $3,200 last month” and “your property’s RevPAR increased 13.8% over the past 3 months, outperforming the local market by 6 points.” One is a number. The other is a story that justifies your management fee.
Setting Up Revenue Reporting in OpenClaw
Revenue reporting is configured as part of your OpenClaw deployment. Here’s what the setup involves:
-
1
Property financial config. Each property’s SOUL.md file gets a
financialssection with the management fee percentage, cleaning cost per turnover, and any fixed monthly expenses. This gives OpenClaw the baseline to calculate NOI accurately. -
2
Owner delivery config. Each owner’s email address, preferred report frequency (monthly, biweekly), and preferred report sections are defined in the SOUL.md owner section. Multi-property owners get a single consolidated report covering all their properties.
-
3
Data source mapping. OpenClaw needs to know which email patterns correspond to which data types. Airbnb payout emails look different from VRBO payout emails. The agent is pre-configured with parsers for all major platforms, but custom channel managers may need a 1-time parser update.
-
4
Schedule and review gate. Configure when reports generate (e.g., 1st of month at 8 AM) and whether you want to review them before they go to owners. The agent runs the workflow on schedule via a systemd timer. Reports for all properties generate in a single batch.
ManageMyClaw handles the complete configuration — financial setup, owner delivery preferences, data source mapping, and schedule — as part of the standard $499 one-time deployment. If you’re already running OpenClaw for guest communication, adding revenue reporting is an incremental configuration update, not a new installation.
For the full property management automation stack — guest messaging, turnover coordination, and owner communication — read our STR property management guide.
Frequently Asked Questions
Can OpenClaw handle properties on different platforms with different fee structures?
Yes. The agent parses payout emails from Airbnb (3% or split fee), VRBO (5%), and Booking.com (15%) individually and applies the correct fee structure for each booking. A property listed on all 3 platforms gets an accurate revenue report that accounts for the different commission rates across platforms. Read our OpenClaw for Airbnb hosts guide for platform-specific details.
What if a booking spans 2 months?
OpenClaw attributes revenue to the month the stay completes (checkout date), which aligns with when the payout is typically processed. A booking that checks in January 28 and checks out February 2 appears in the February report. This matches cash-basis accounting, which is what most property owners and their accountants prefer.
Can I export the report data for my own accounting?
The report data is structured and stored on your server. You can configure OpenClaw to generate a CSV export alongside the owner email report, giving you a clean data file for import into QuickBooks, Xero, or your property management accounting system. The CSV includes every line item: booking ID, dates, revenue, platform, fees, cleaning, and maintenance.
How does OpenClaw handle cancellations and refunds?
Cancellation and refund notification emails are parsed the same way as booking confirmations. If a booking is cancelled before the stay, it’s removed from the revenue calculation. If a partial refund is issued after a stay, the report shows the adjusted amount. The report always reflects actual revenue received, not originally booked amounts.
Is the revenue data stored securely?
All data stays on your server. OpenClaw runs on bare-metal infrastructure that you control, managed by systemd. Financial data is never sent to a third-party cloud. The report generation, storage, and email delivery all happen on your VPS. This is one of the core advantages of open-source, self-hosted AI — your owners’ financial data never leaves your infrastructure.